Industrial Properties
13581 Pond Springs Road Austin, TX 78729
13581 Pond Springs Road Austin, TX 78729
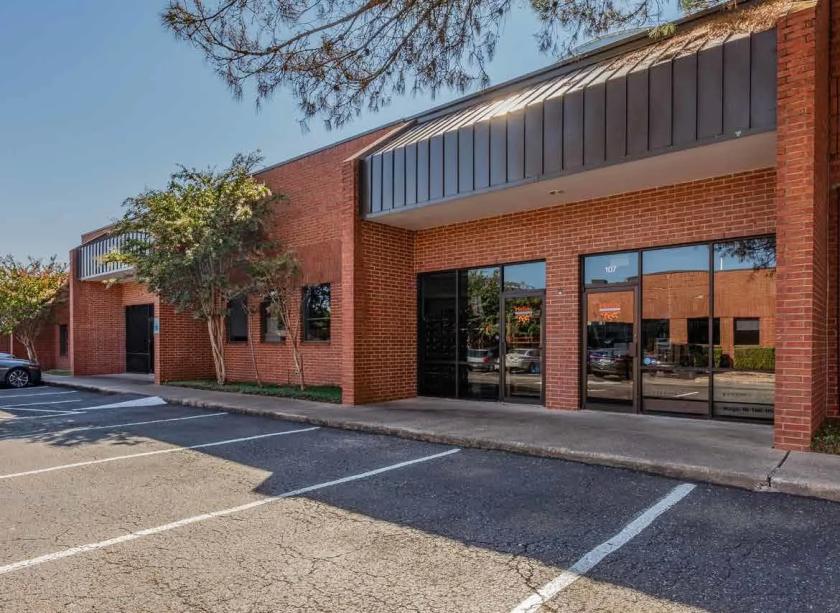
Details & Description
Property Highlights
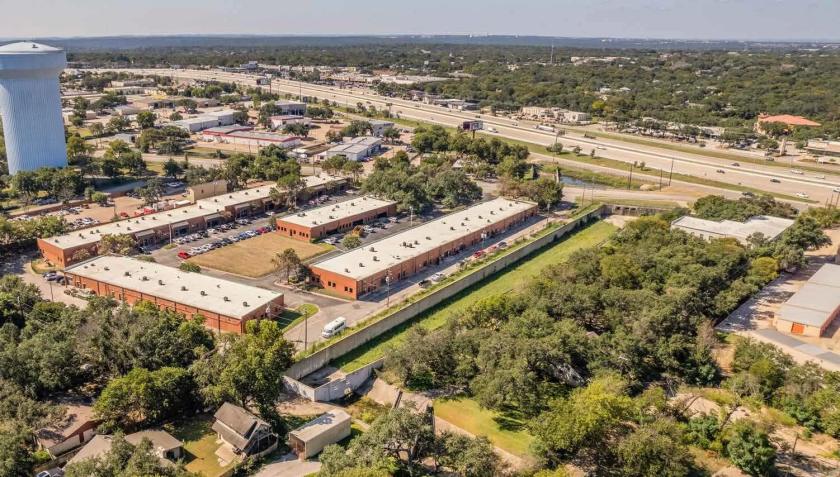
• Located near the new Apple campus, Lakeline Mall, The Domain and The Arboretum
• Located just off Highway 183 with easy access to Highway 45
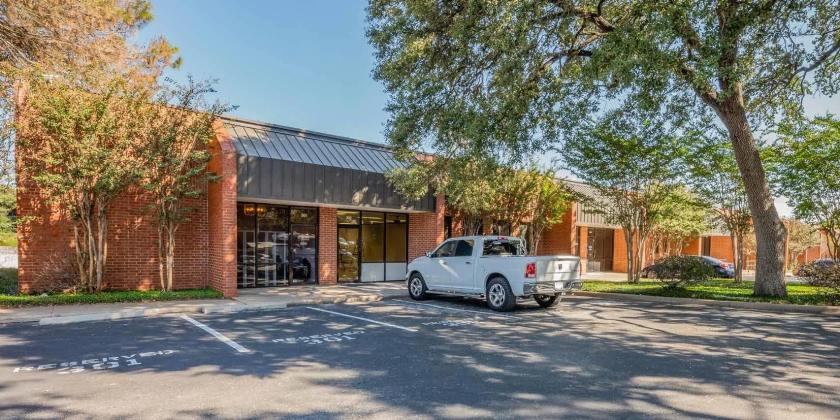
Additional Photos

Listing Agents

Jeremy Avera
O: 512-447-2222
M: 512-574-4402
jeremy@csarealtygroup.com
O: 512-447-2222
M: 512-574-4402
jeremy@csarealtygroup.com

Hunter Muth
O: 512-447-2222
M: 512-750-6242
hunter@csarealtygroup.com
O: 512-447-2222
M: 512-750-6242
hunter@csarealtygroup.com

Andrew Creixell
O: 512-447-2222
andrew@csarealtygroup.com
O: 512-447-2222
andrew@csarealtygroup.com
While we strive to provide the most accurate information, all listing information, and demographic data, is provided by third-parties. As such, MyEListing will not be responsible for the accuracy of the information. It is strongly recommended that you verify all information with the listing agent, and any relevant agencies, prior to making any decisions.