Industrial Properties
4139 Felter Lane Austin, TX 78744
4139 Felter Lane Austin, TX 78744
Details & Description
Property Highlights
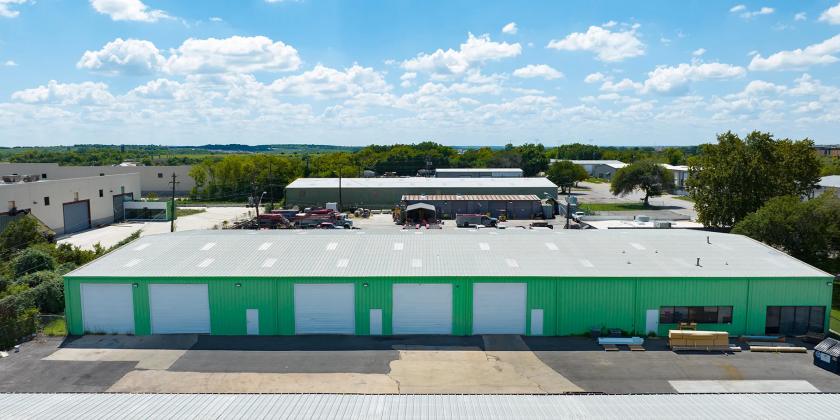
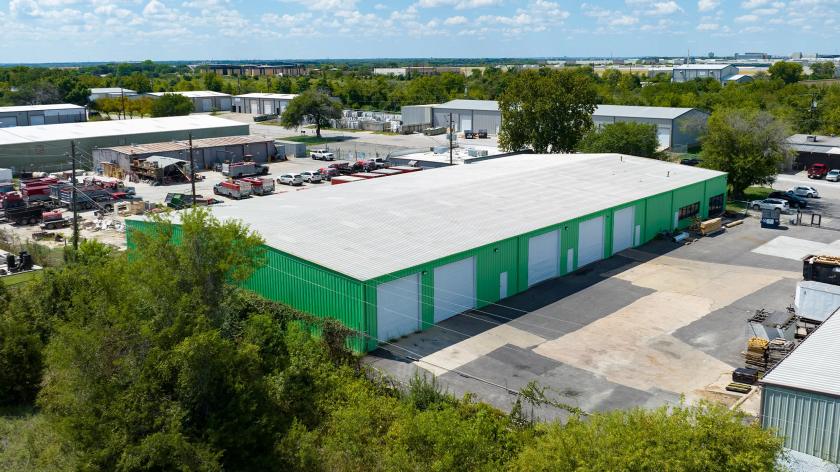
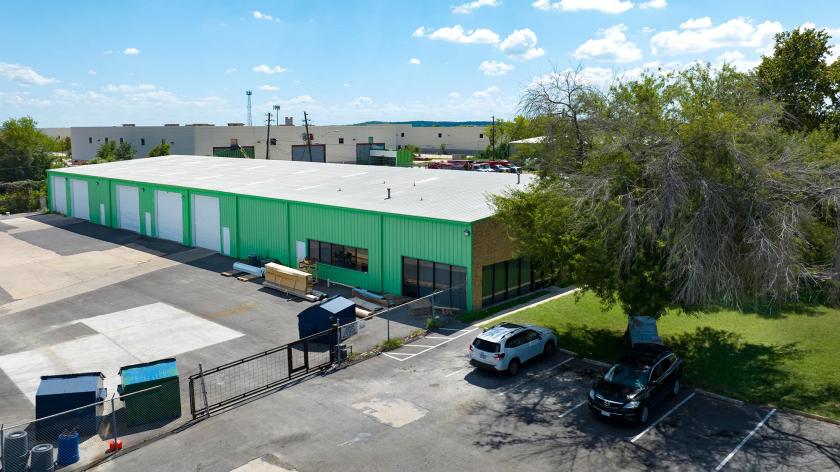
• The space has two 14'x14' overhead grade level doors and one 14'x14' dock high door
• Available is 11,111 SF of office and warehouse, approximately 1,000 SF of office the rest is warehouse
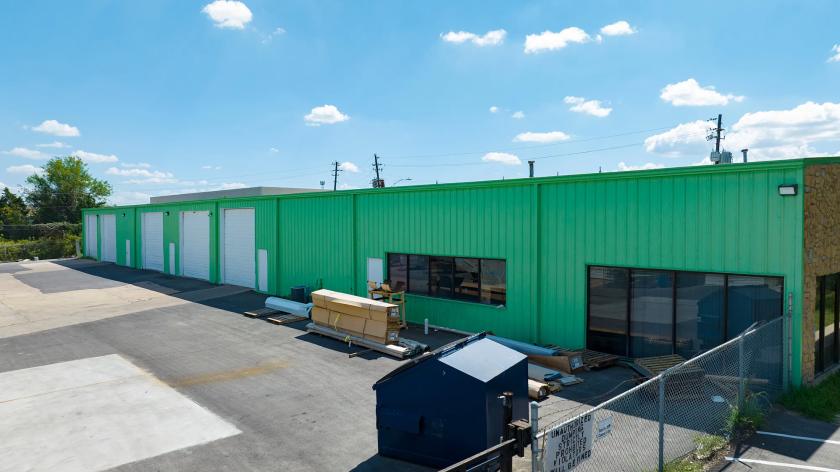
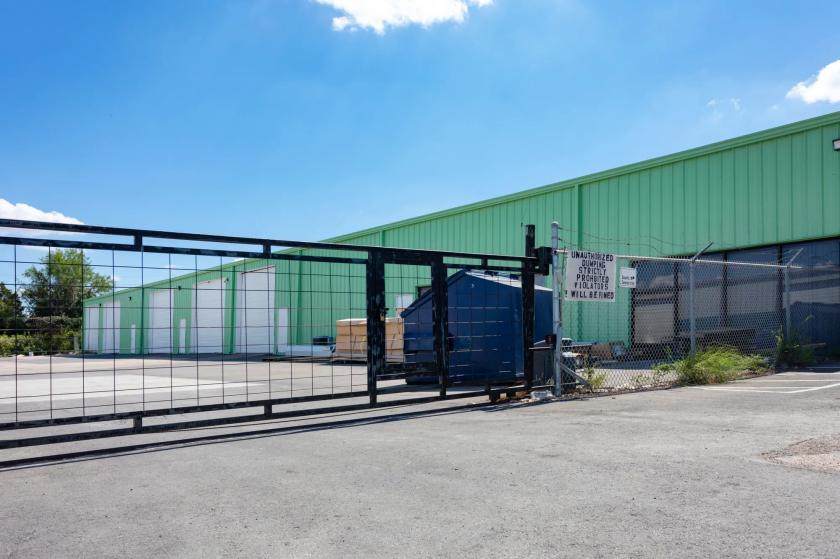
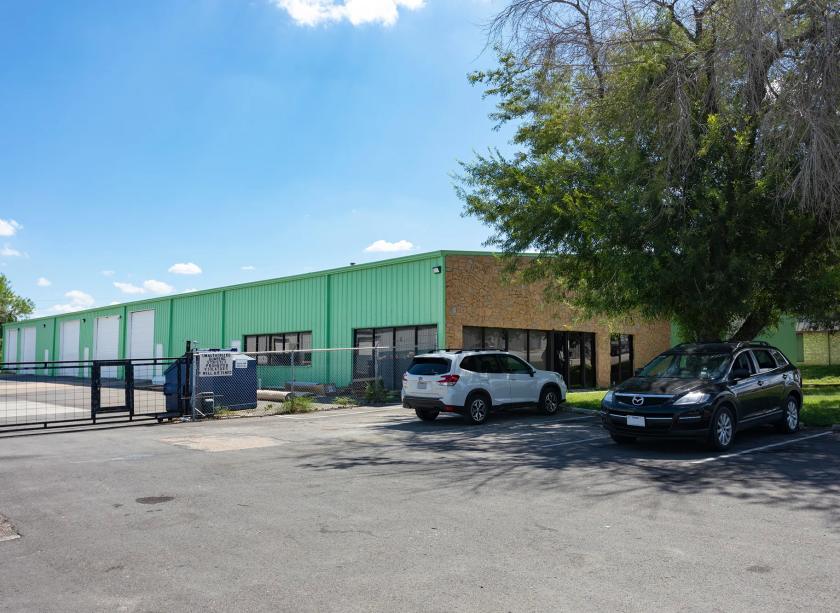
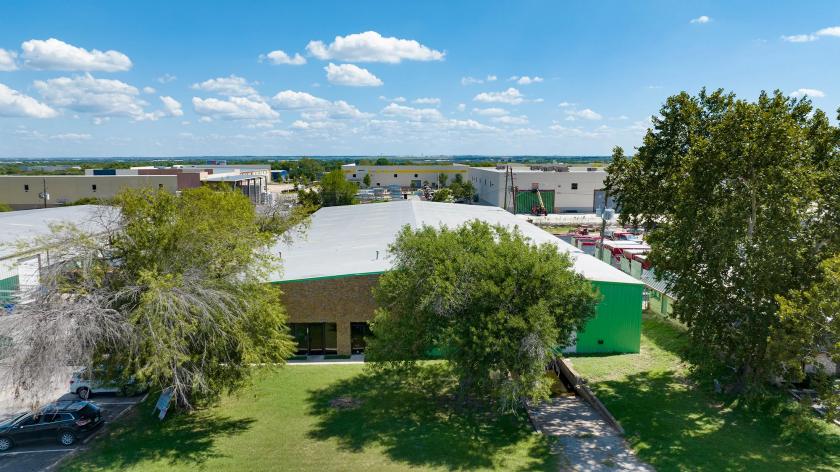
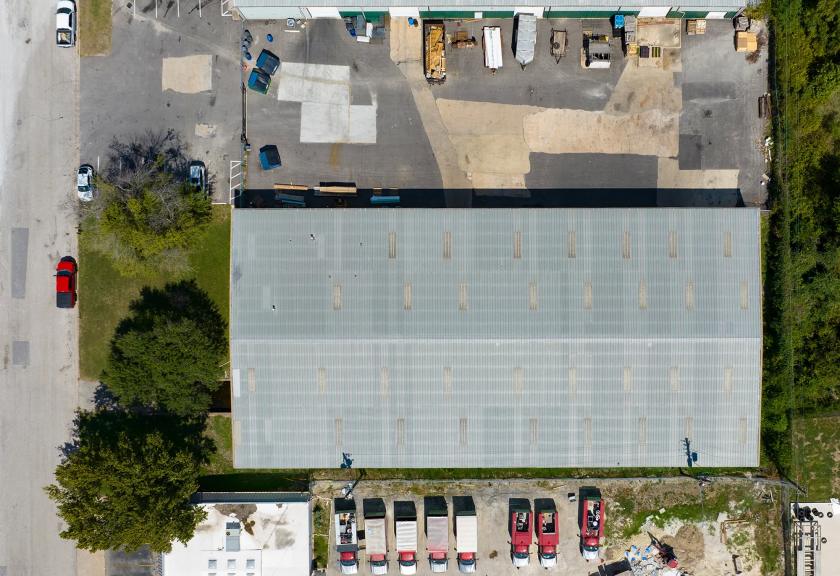
Additional Photos
Listing Agents

Hunter Muth
O: 512-447-2222
M: 512-750-6242
hunter@csarealtygroup.com
O: 512-447-2222
M: 512-750-6242
hunter@csarealtygroup.com
While we strive to provide the most accurate information, all listing information, and demographic data, is provided by third-parties. As such, MyEListing will not be responsible for the accuracy of the information. It is strongly recommended that you verify all information with the listing agent, and any relevant agencies, prior to making any decisions.