Retail Space
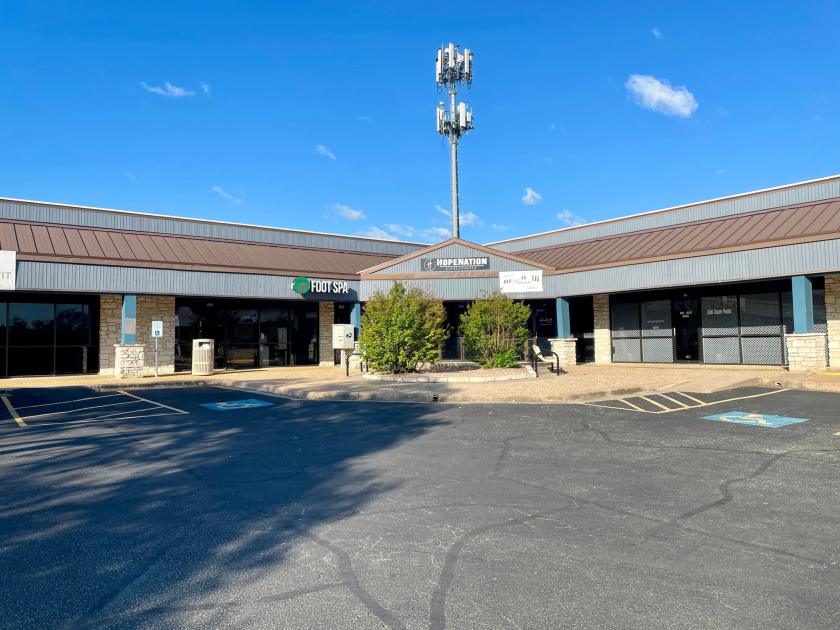
12400 Amherst Drive Austin, TX 78727
12400 Amherst Drive Austin, TX 78727
Details & Description
Property Highlights
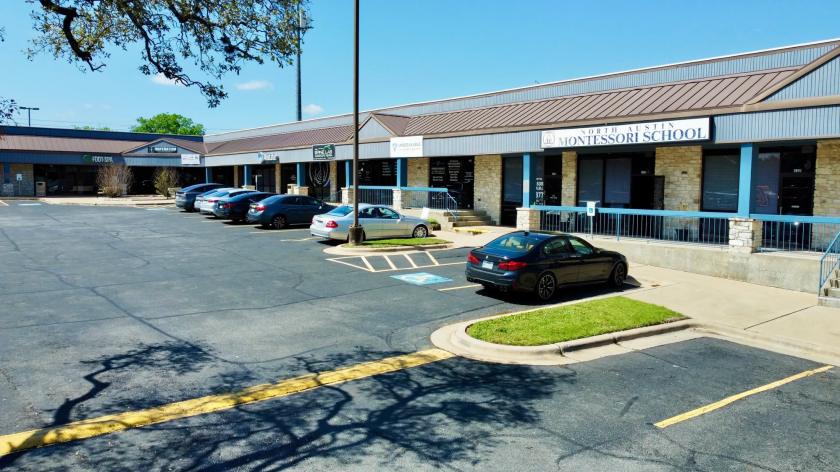
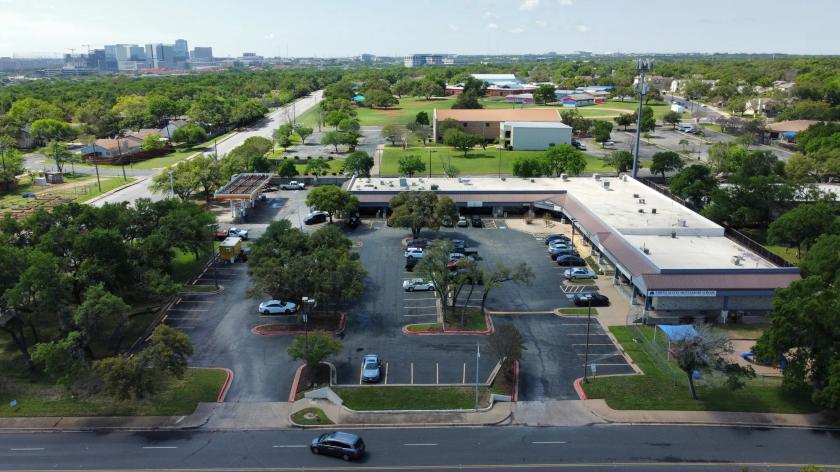
- • Easy Ingress/Egress
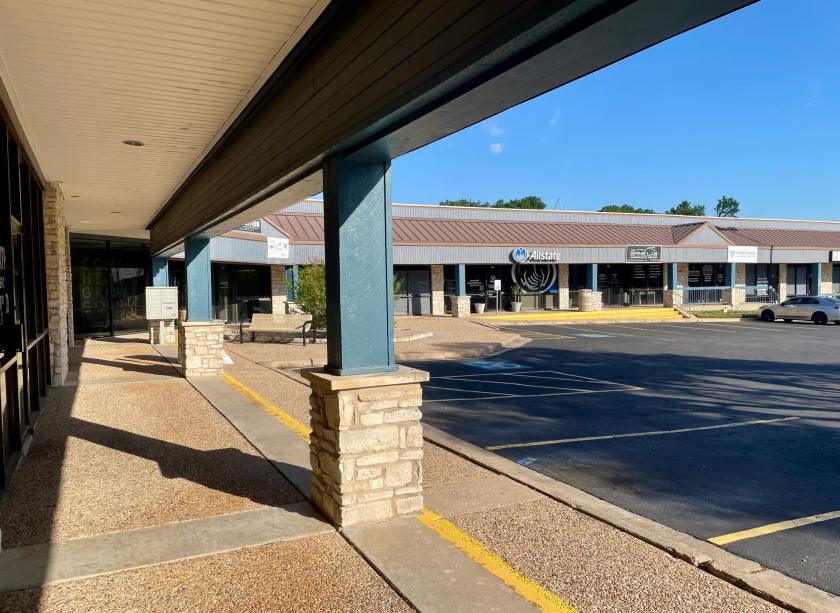
- • Great Visibility
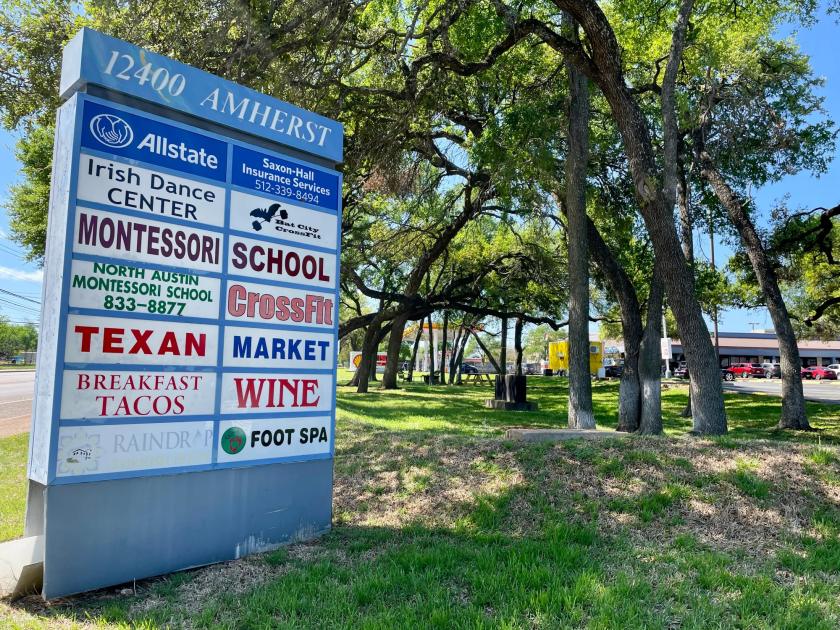
- • Monument Signage
Additional Photos
Listing Agents

Chris Gerlach
O: 512-447-2222
chris@csarealtygroup.com
O: 512-447-2222
chris@csarealtygroup.com
While we strive to provide the most accurate information, all listing information, and demographic data, is provided by third-parties. As such, MyEListing will not be responsible for the accuracy of the information. It is strongly recommended that you verify all information with the listing agent, and any relevant agencies, prior to making any decisions.