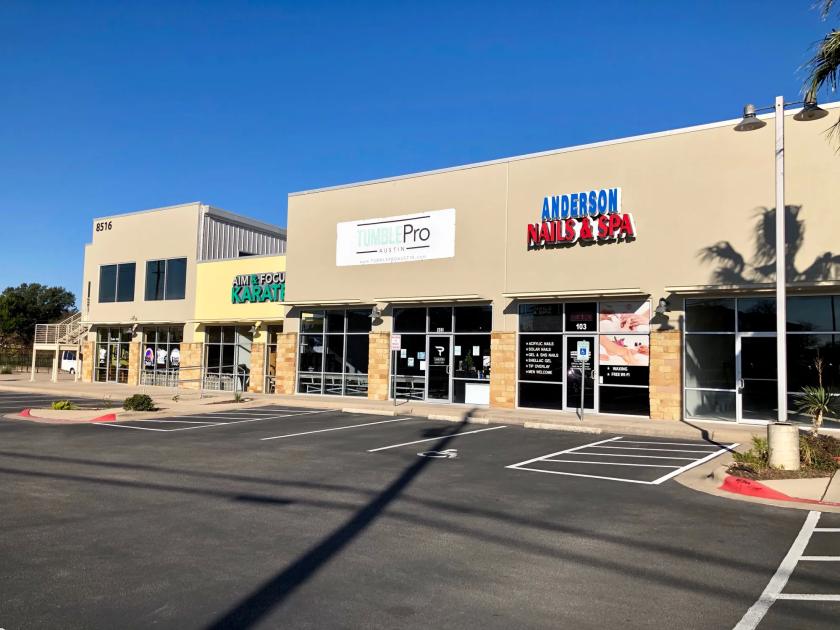
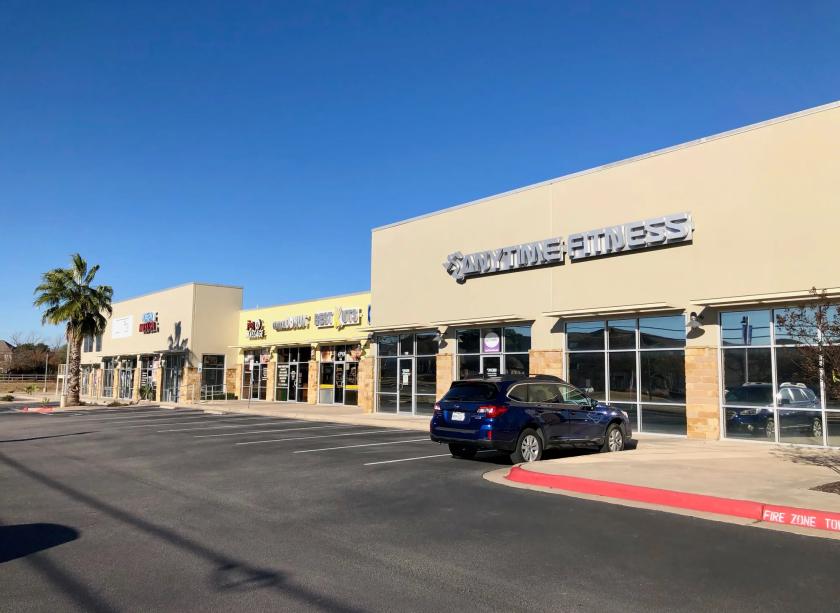
1-Mile | 3-Miles | 5-Miles | ||
---|---|---|---|---|
Total Population | 12,916 | 91,622 | 225,581 | |
Population Median Age | 35 | 36 | 36 | |
Population by Age | 0-9 Yrs | 1703 (13%) | 11646 (12%) | 28311 (12%) |
10-19 Yrs | 1140 (8%) | 10508 (11%) | 28067 (12%) | |
20-29 Yrs | 1992 (15%) | 12994 (14%) | 31137 (13%) | |
30-39 Yrs | 2774 (21%) | 18128 (19%) | 41458 (18%) | |
40-49 Yrs | 2276 (17%) | 14334 (15%) | 36281 (16%) | |
50-59 Yrs | 1654 (12%) | 10968 (11%) | 27296 (12%) | |
60-69 Yrs | 896 (6%) | 7303 (7%) | 18154 (8%) | |
70+ Yrs | 481 (3%) | 5741 (6%) | 14877 (6%) | |
Median HH Income | $83,329 | $86,967 | $91,997 | |
Total Household Income | < 24K | 298 (5%) | 3146 (8%) | 7877 (8%) |
25-49K | 1011 (18%) | 6123 (16%) | 13618 (15%) | |
50-74K | 1188 (21%) | 6907 (18%) | 15633 (17%) | |
75-99K | 631 (11%) | 4293 (11%) | 10496 (11%) | |
100-199K | 1910 (35%) | 11839 (32%) | 29239 (33%) | |
200K+ | 376 (6%) | 4155 (11%) | 11668 (13%) | |
Highest Education Level | No Diploma | 414 | 2768 | 5575 |
Diploma or GED | 1084 | 7666 | 18551 | |
Some College | 2419 | 12697 | 29712 | |
Assoc. Degree | 538 | 4293 | 11501 | |
Bachelors Degree | 3591 | 22904 | 57423 | |
Higher Degree | 1535 | 15116 | 35317 | |
Total Housing Units | 5,999 | 39,431 | 94,793 | |
--Owner-Occupied | 2,435 | 16,981 | 45,290 | |
--Renter-Occupied | 2,979 | 19,481 | 43,241 | |
Owner-Occupied Values | < 100K | 39 | 246 | 642 |
100-199K | 161 | 1261 | 3215 | |
200-299K | 798 | 4256 | 11411 | |
300-399K | 1187 | 4869 | 12382 | |
400-499K | 215 | 2926 | 8655 | |
500K+ | 36 | 3423 | 8986 | |
Total Working Age Population | 10,509 | 73,044 | 178,864 | |
In Work Force | 8,438 | 54,809 | 132,297 | |
Not In Work Force | 2,071 | 18,234 | 46,567 | |
Workforce Employed | 8,198 | 52,215 | 126,285 | |
Workforce Unemployed | 241 | 2,586 | 5,905 | |
Civlian Workforce | 8,438 | 54,801 | 132,190 | |
Military Workforce | 0 | 9 | 107 | |
Total Households | 5,414 | 36,462 | 88,531 | |
Family Households | 3,063 | 21,970 | 54,048 | |
Non-Family Households | 2,351 | 14,492 | 34,483 | |
Married Couple | 2,446 | 17,408 | 43,829 | |
Other Family | 617 | 4,563 | 10,219 | |
Married w/Child | 1,079 | 8,862 | 22,830 | |
Single Male w/Child | 73 | 686 | 1,307 | |
Single Female w/Child | 305 | 1,598 | 3,871 |
Population Change Last Two Decades - Plus Projection
2000 | % | 2010 | % | 2020 | % | 2030 | |
---|---|---|---|---|---|---|---|
Texas | 20,851,820 | +21 | 25,145,561 | +18 | 29,677,668 | +18 | 34,894,452 |
Travis County | 812,280 | +26 | 1,024,266 | +26 | 1,291,502 | +19 | 1,540,812 |
Williamson County | 249,967 | +69 | 422,679 | +40 | 589,914 | +41 | 830,421 |
Total Working Age Population:
Total Households:
Total Working Age Population:
Total Households:
Total Working Age Population:
Total Households: