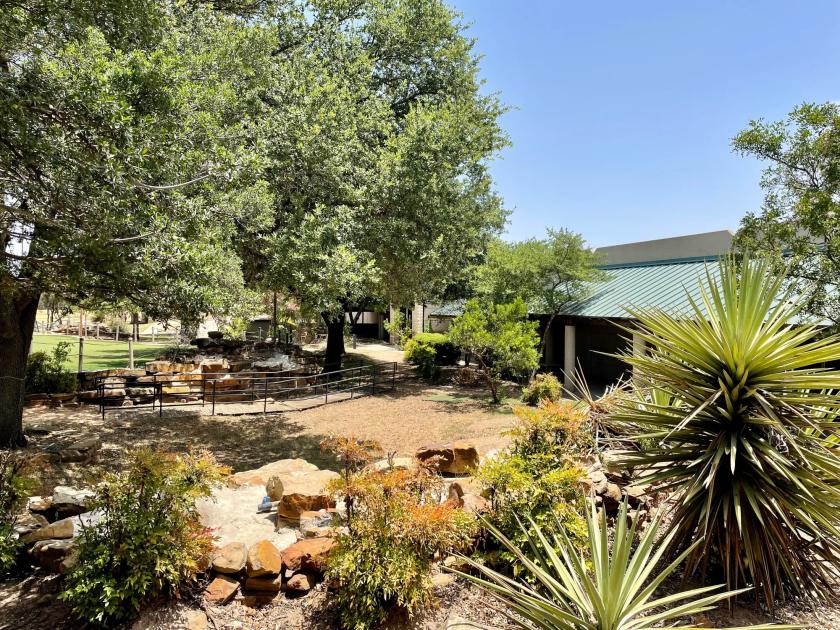
Industrial Properties
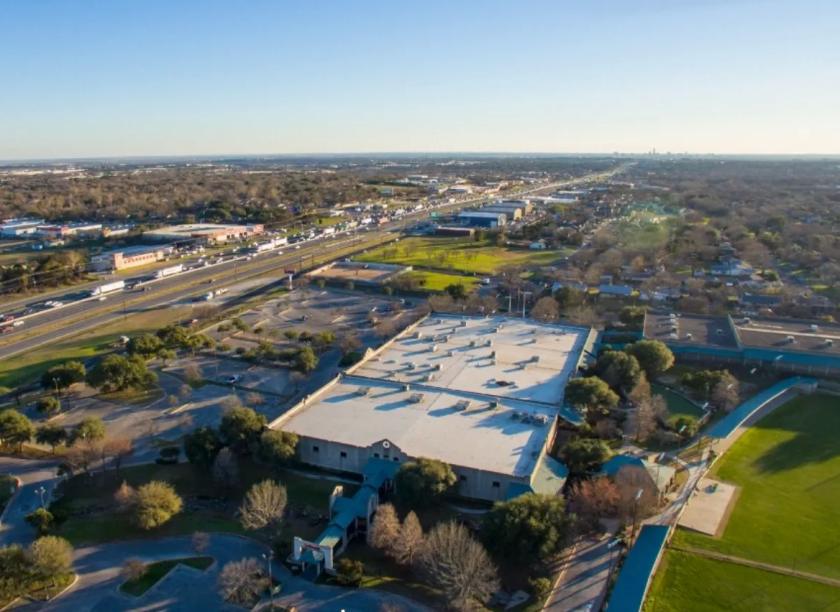
11000 North Interstate Highway 35 Austin, TX 78753
11000 North Interstate Highway 35 Austin, TX 78753
Details & Description
Property Highlights
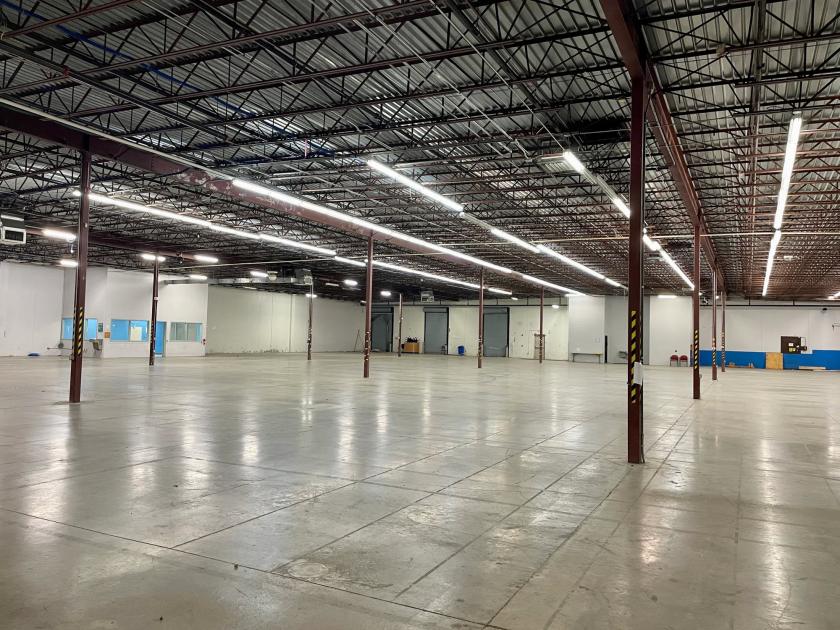
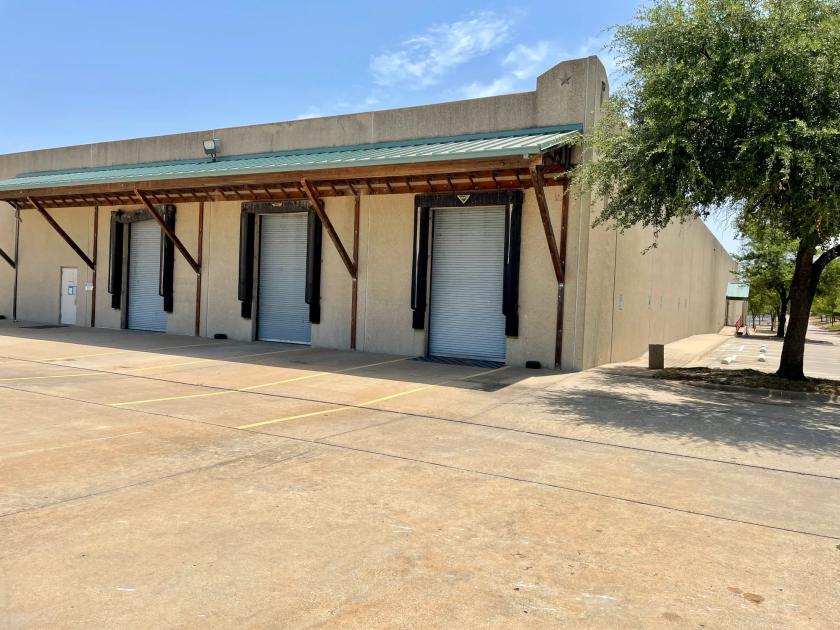
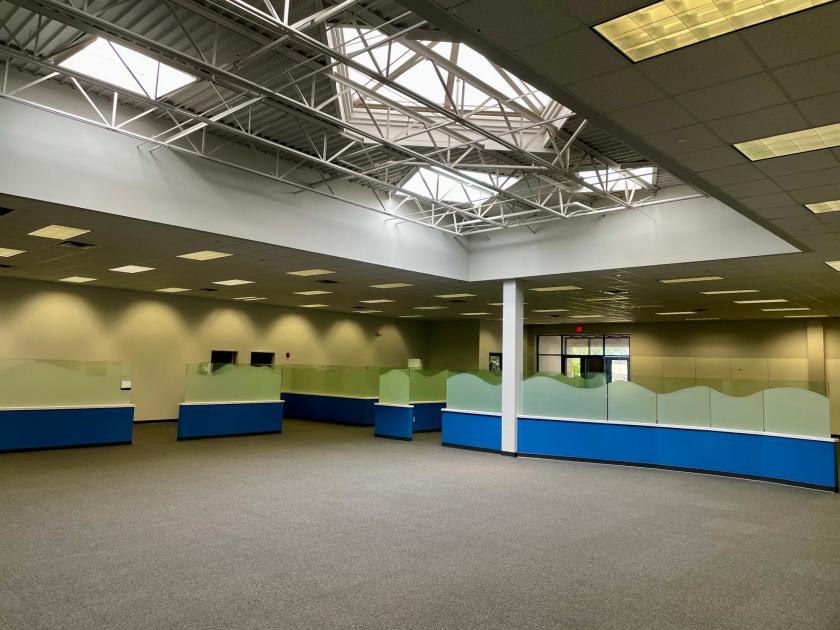
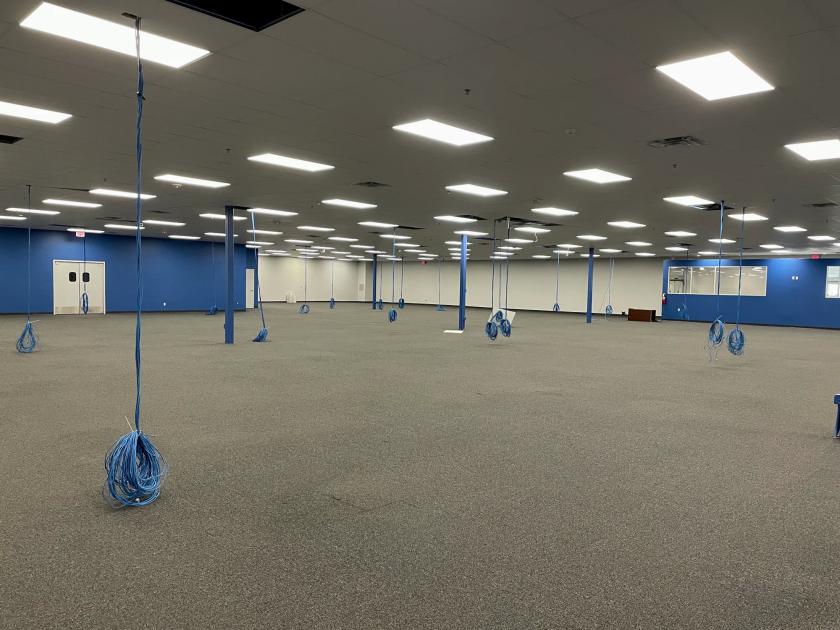
- • Former Golfsmith, Buildings A, B and C
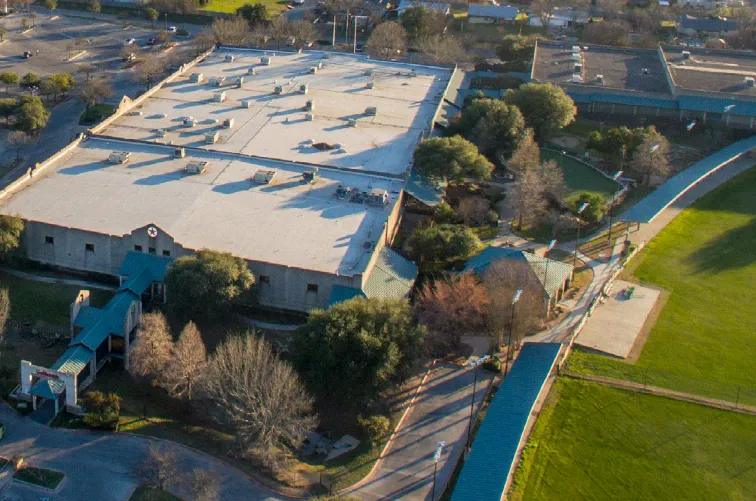
- • Ideally situated in North Austin on IH-35
- • 10 Minutes to Downtown Austin
- • 30 Minutes to Tesla Giga Factory
- • 4 Restrooms
- • Break Room
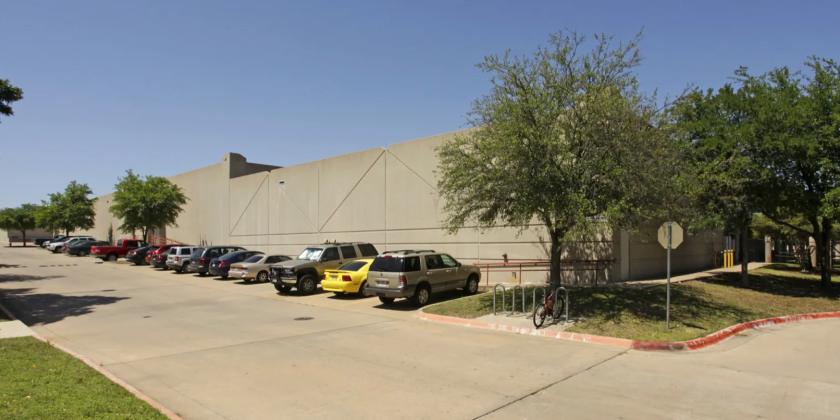
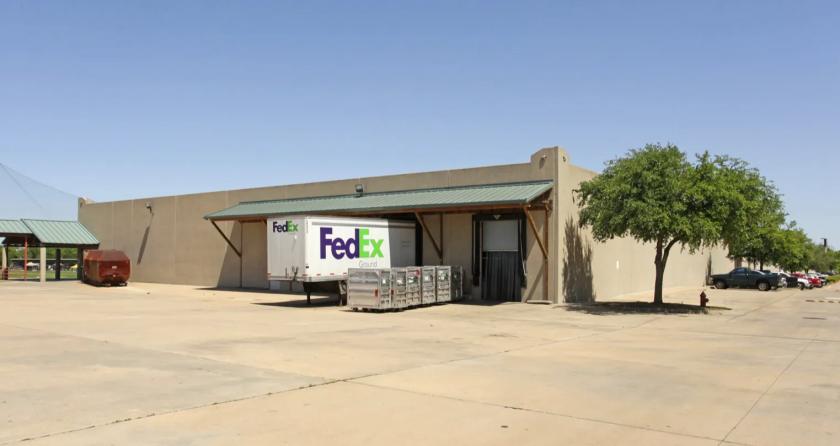
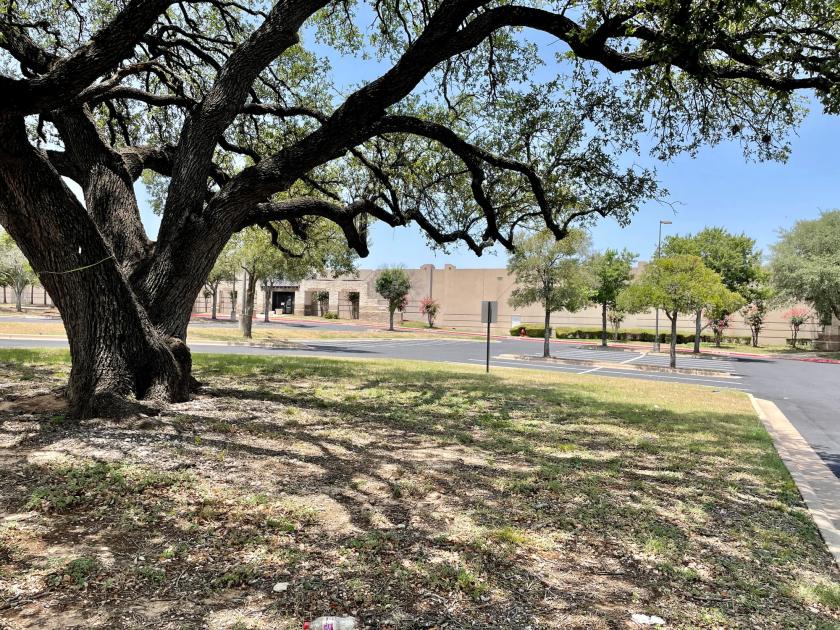
Additional Photos
Listing Agents

Andrew Creixell
O: 512-447-2222
andrew@csarealtygroup.com
O: 512-447-2222
andrew@csarealtygroup.com

Chris Gerlach
O: 512-447-2222
chris@csarealtygroup.com
O: 512-447-2222
chris@csarealtygroup.com
While we strive to provide the most accurate information, all listing information, and demographic data, is provided by third-parties. As such, MyEListing will not be responsible for the accuracy of the information. It is strongly recommended that you verify all information with the listing agent, and any relevant agencies, prior to making any decisions.