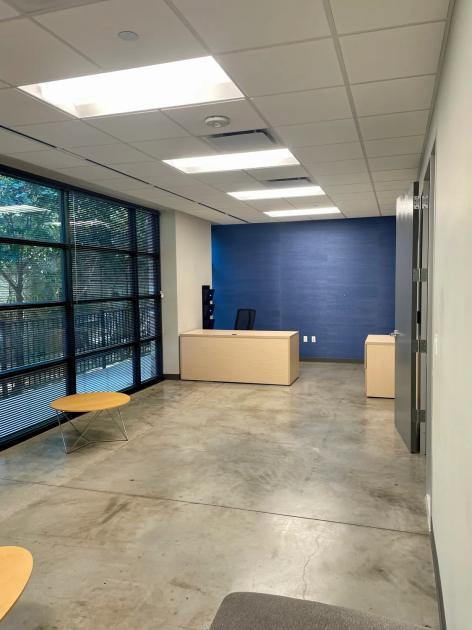
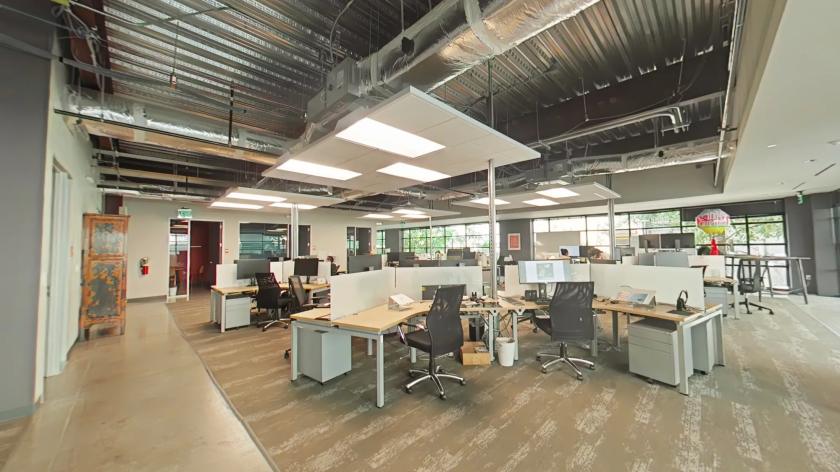
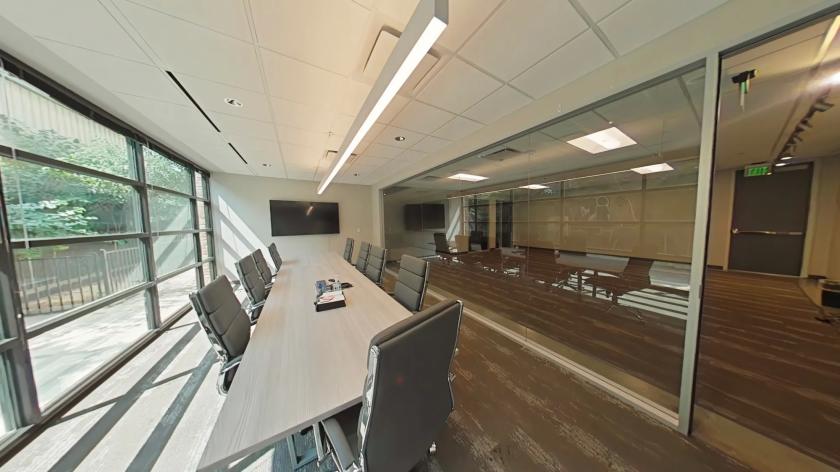
Office Space
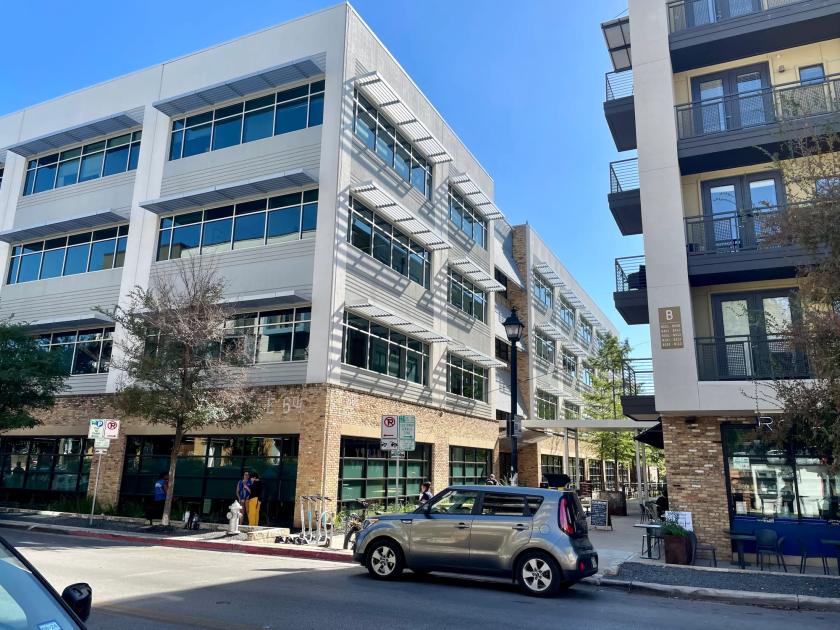
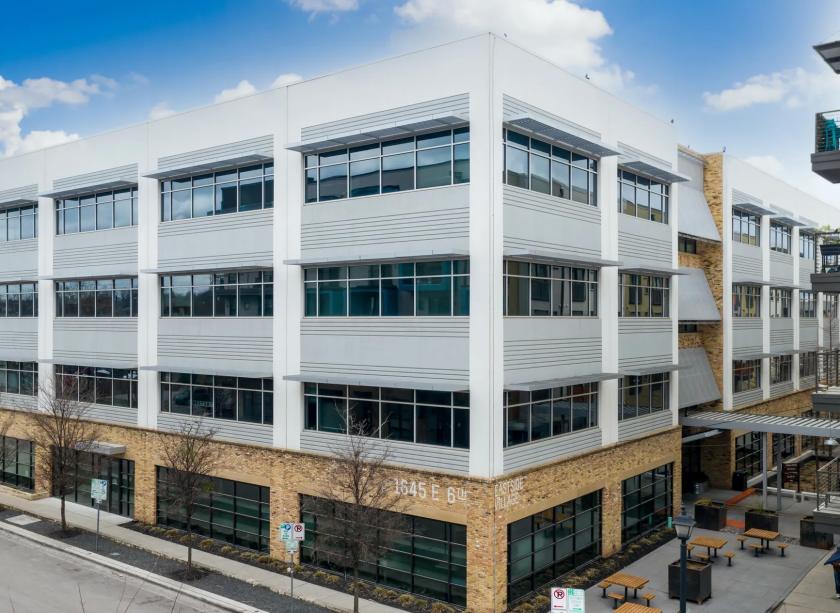
1645 East 6th Street Austin, TX 78702
1645 East 6th Street Austin, TX 78702
Details & Description
Property Highlights
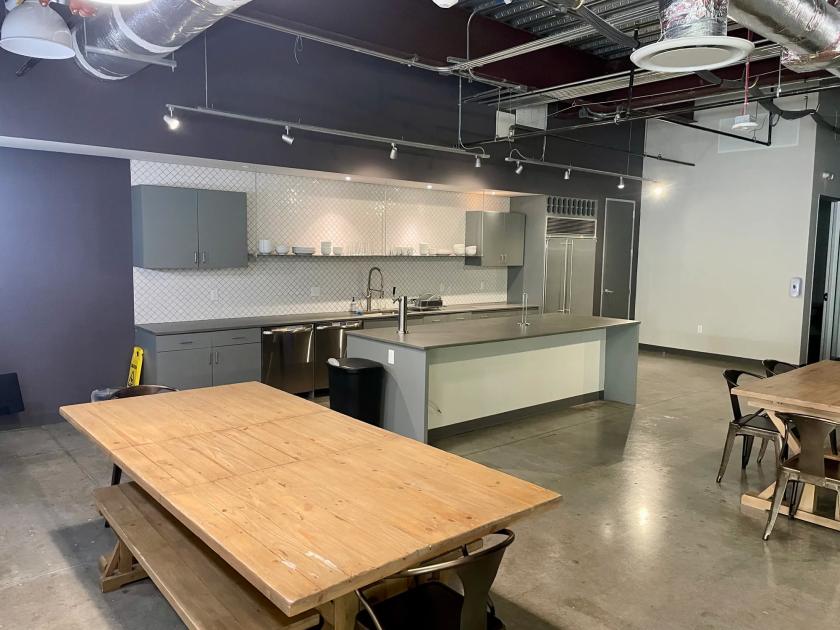
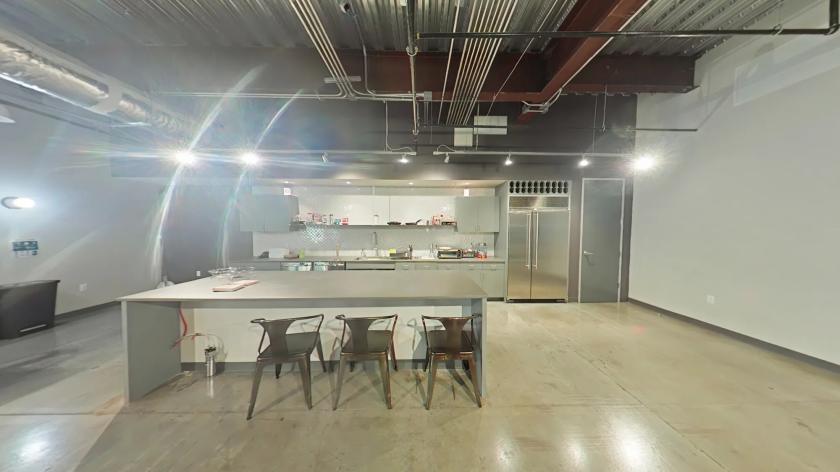
- • Large Kitchenette
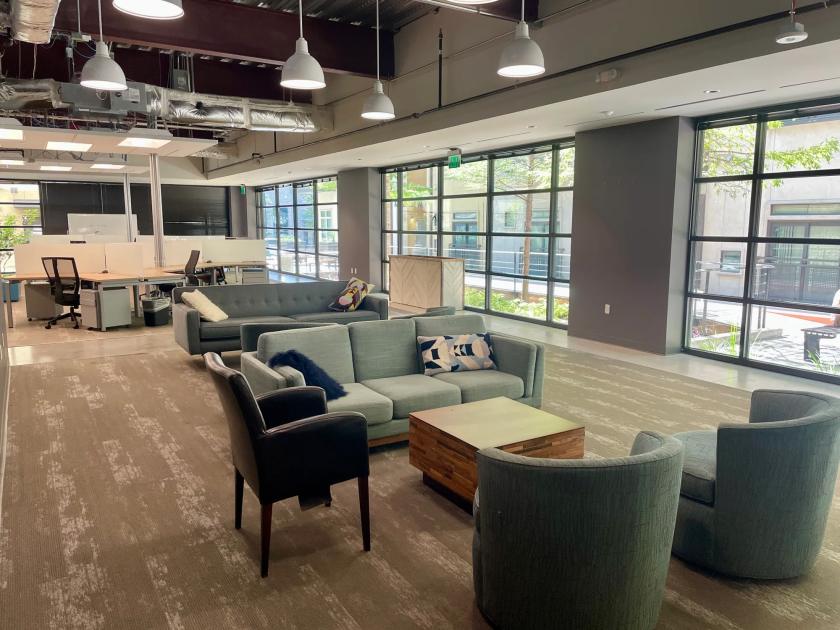
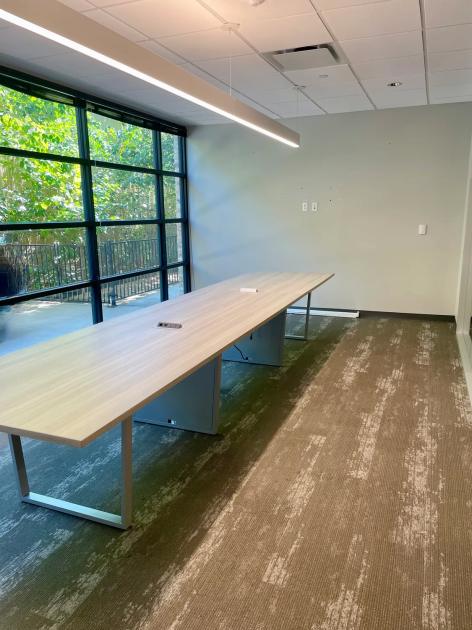
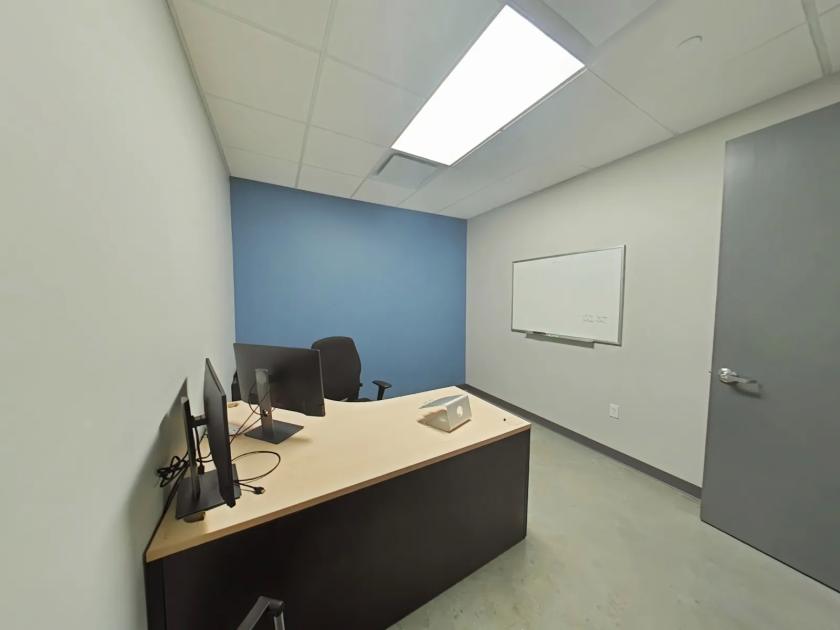
- • Furniture Available
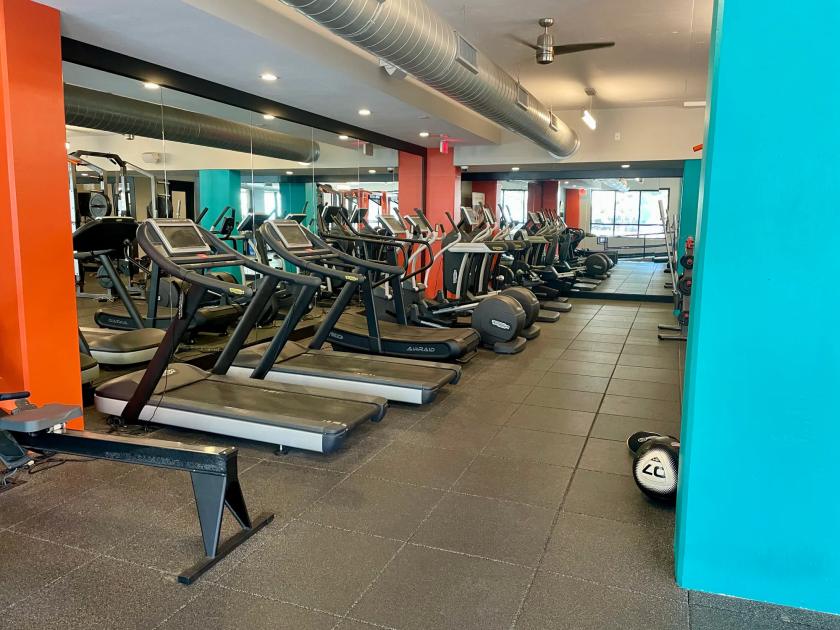
- • Fitness Center
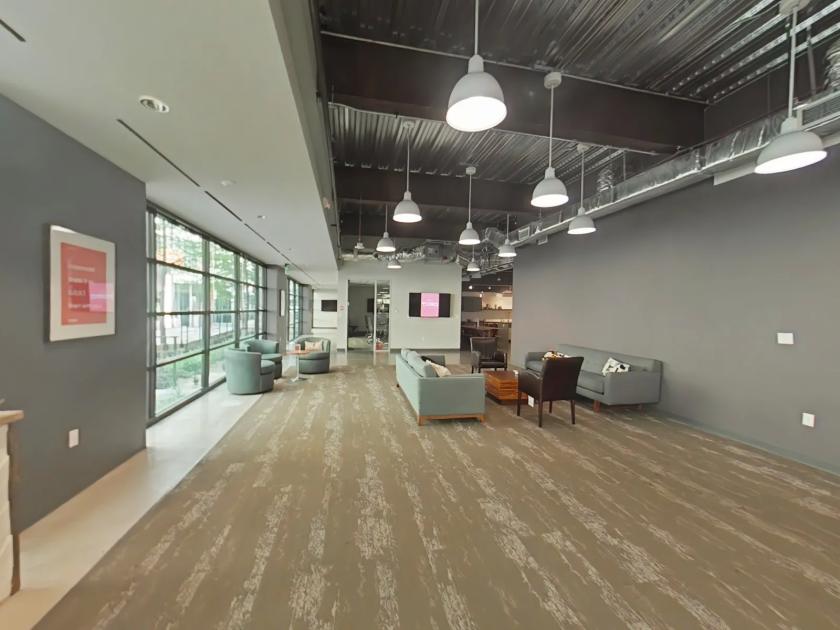
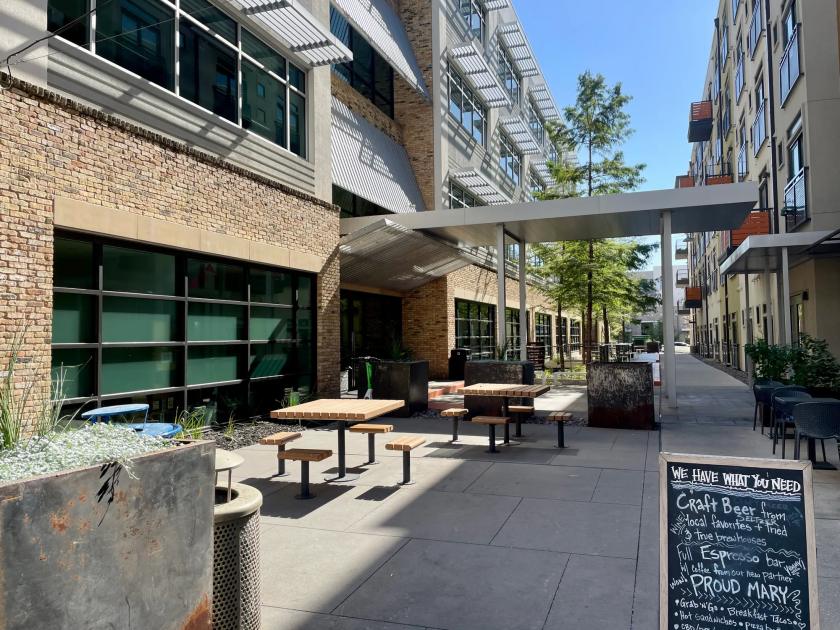
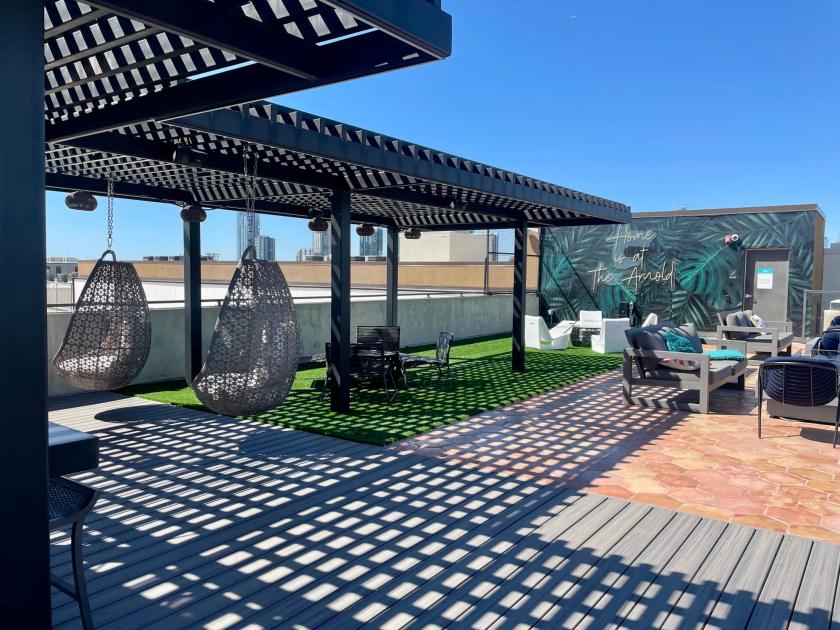
- • Access to Rooftop Terrace
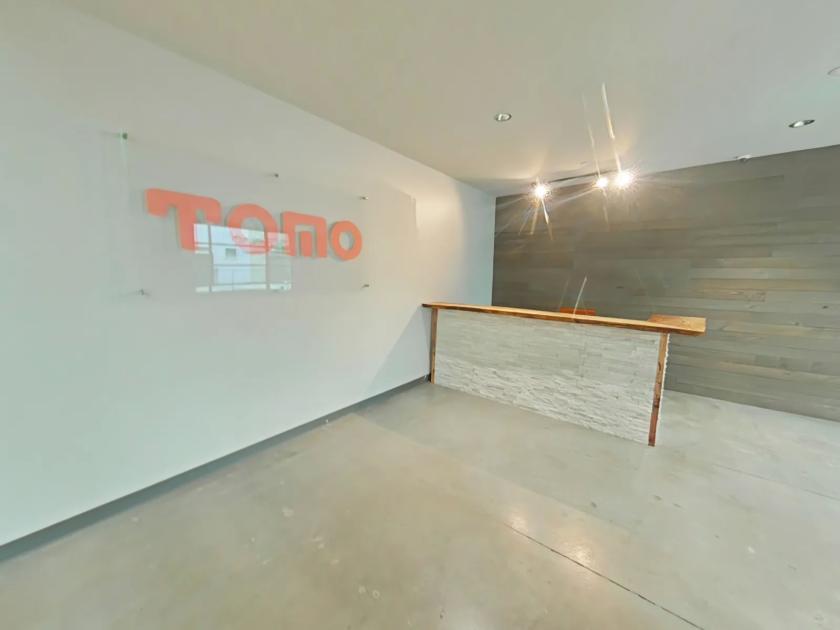
- • Lobby Exposure
- • Security
Additional Photos
Listing Agents

Andrew Creixell
O: 512-447-2222
andrew@csarealtygroup.com
O: 512-447-2222
andrew@csarealtygroup.com

Chris Gerlach
O: 512-447-2222
chris@csarealtygroup.com
O: 512-447-2222
chris@csarealtygroup.com
While we strive to provide the most accurate information, all listing information, and demographic data, is provided by third-parties. As such, MyEListing will not be responsible for the accuracy of the information. It is strongly recommended that you verify all information with the listing agent, and any relevant agencies, prior to making any decisions.