Retail Space
450 South Kiwanis Avenue Sioux Falls, SD 57104
450 South Kiwanis Avenue Sioux Falls, SD 57104
Details & Description
Property Highlights
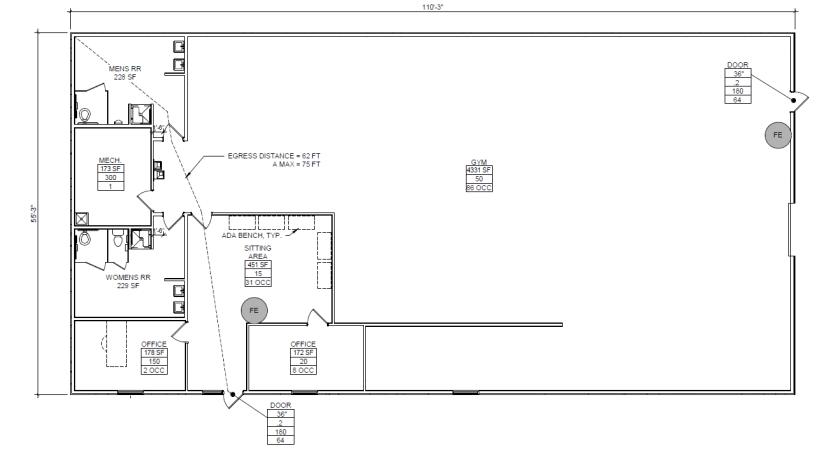
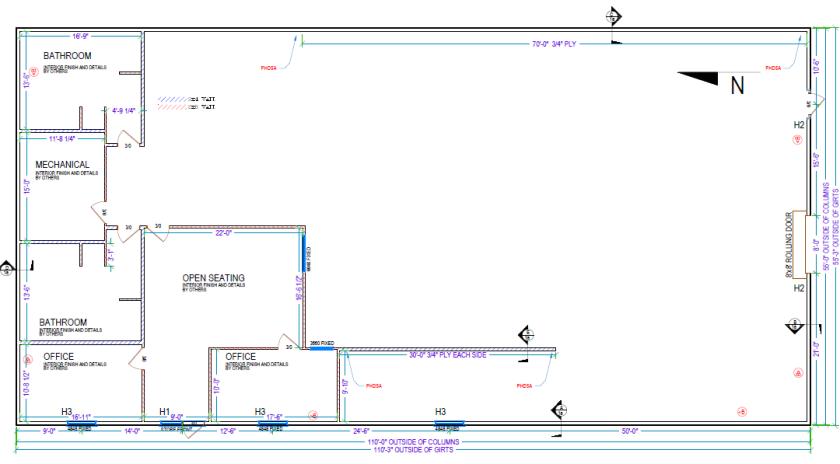
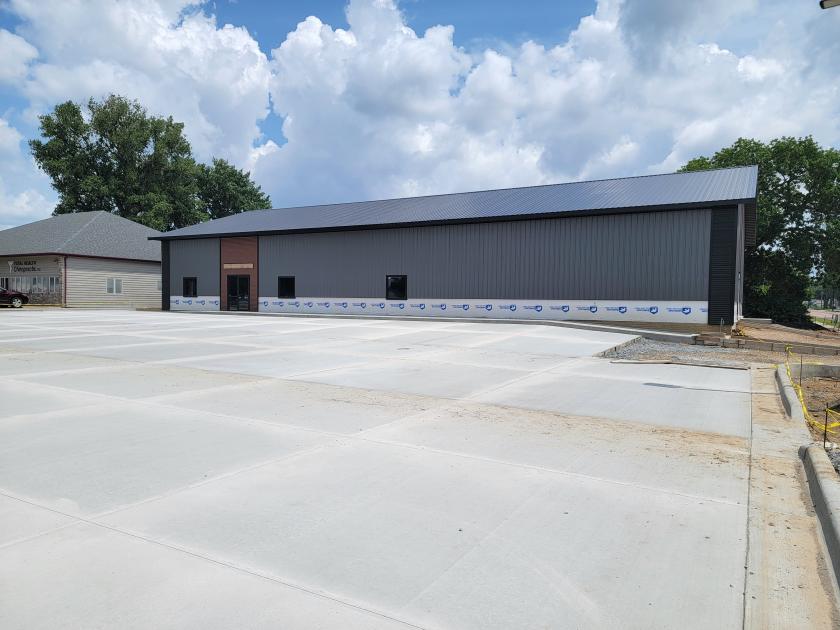
- • Delivering vacant shell Q2 2024
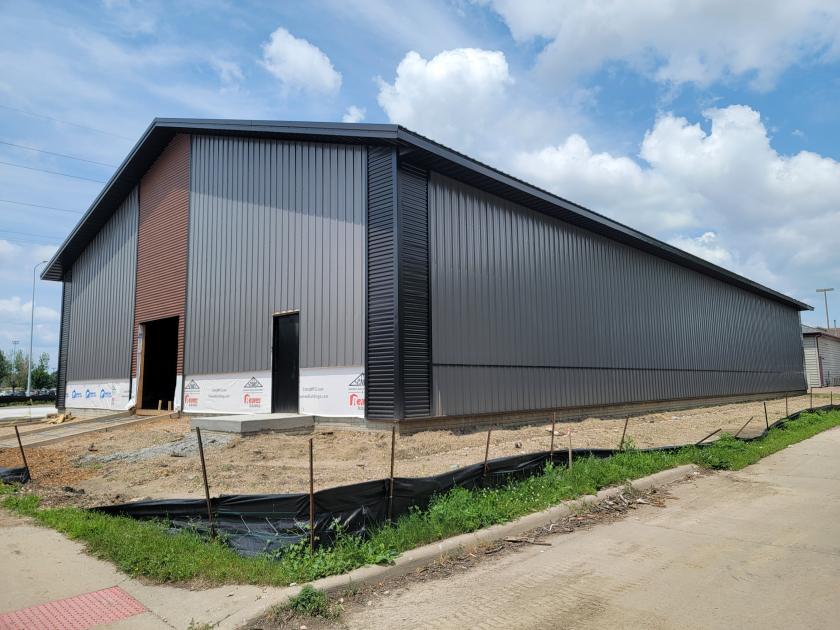
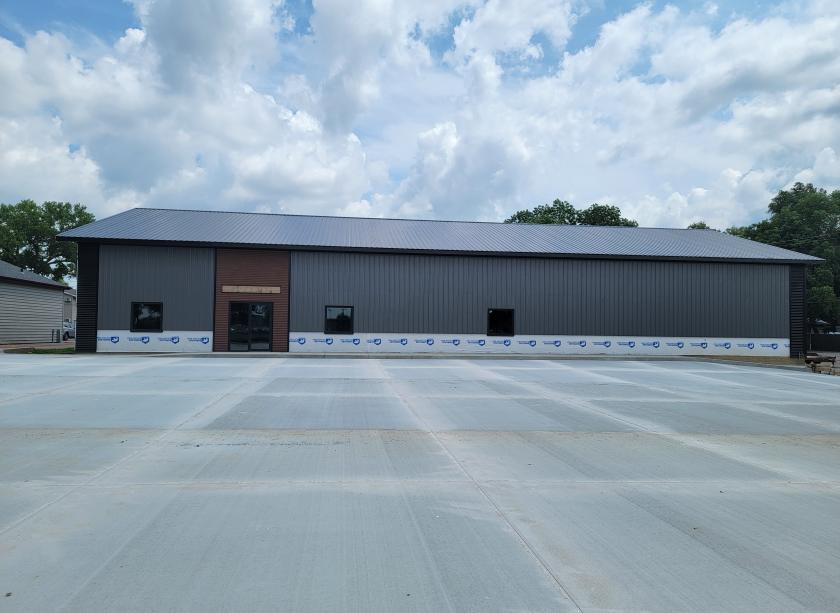
- • Brand new Reaves building
- • Zoning: C-2
Additional Photos

Listing Agents

Gregg Brown
O: 605-444-7103
M: 605-906-0394
gbrown@naisiouxfalls.com
O: 605-444-7103
M: 605-906-0394
gbrown@naisiouxfalls.com

Brody Etrheim
betrheim@naisiouxfalls.com
betrheim@naisiouxfalls.com
While we strive to provide the most accurate information, all listing information, and demographic data, is provided by third-parties. As such, MyEListing will not be responsible for the accuracy of the information. It is strongly recommended that you verify all information with the listing agent, and any relevant agencies, prior to making any decisions.