Office Space
6211 West William Cannon Drive Austin, TX 78749
6211 West William Cannon Drive Austin, TX 78749
Details & Description
Property Highlights
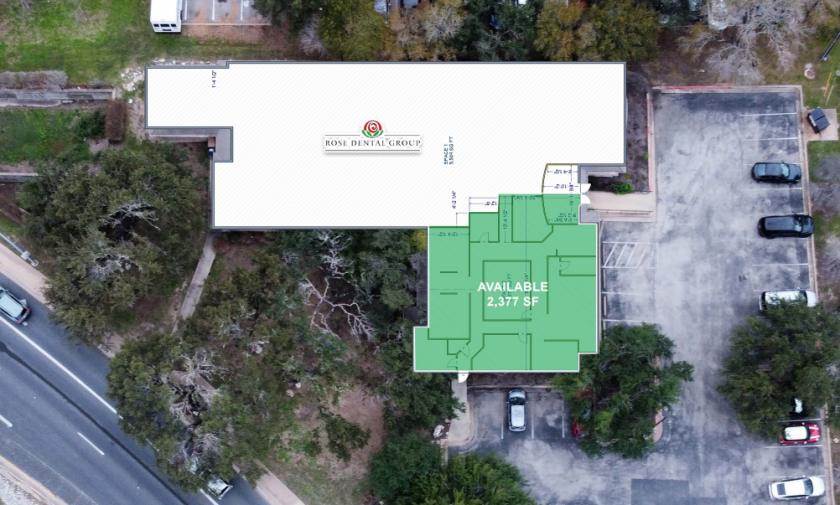
• The former tenant was a dentist who had downsized within the building
• The former tenant was a dentist who had downsized within the building
Listing Agents

Michael Noteboom
O: 512-695-6958
mnoteboom@resolutre.com
O: 512-695-6958
mnoteboom@resolutre.com
While we strive to provide the most accurate information, all listing information, and demographic data, is provided by third-parties. As such, MyEListing will not be responsible for the accuracy of the information. It is strongly recommended that you verify all information with the listing agent, and any relevant agencies, prior to making any decisions.