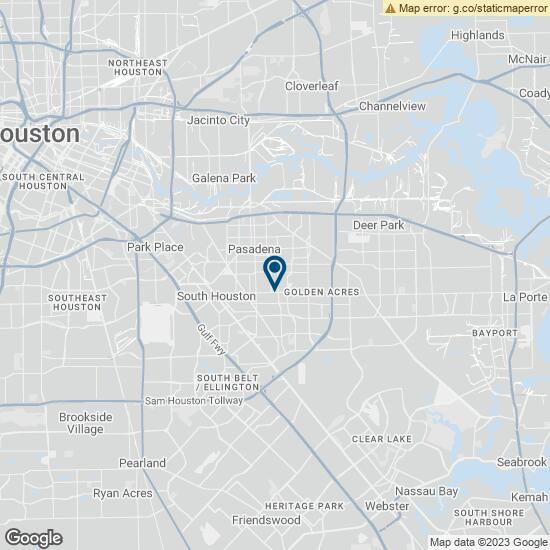
1-Mile | 3-Miles | 5-Miles | ||
---|---|---|---|---|
Total Population | 18,230 | 150,858 | 300,596 | |
Population Median Age | 32 | 33 | 33 | |
Population by Age | 0-9 Yrs | 3202 (17%) | 24706 (16%) | 48781 (16%) |
10-19 Yrs | 3212 (17%) | 26614 (17%) | 49907 (16%) | |
20-29 Yrs | 3021 (16%) | 22970 (15%) | 47308 (15%) | |
30-39 Yrs | 2522 (13%) | 19782 (13%) | 40197 (13%) | |
40-49 Yrs | 1865 (10%) | 18955 (12%) | 39195 (13%) | |
50-59 Yrs | 1842 (10%) | 17535 (11%) | 35157 (11%) | |
60-69 Yrs | 1343 (7%) | 11303 (7%) | 23127 (7%) | |
70+ Yrs | 1223 (6%) | 8995 (5%) | 16924 (5%) | |
Median HH Income | $41,029 | $51,067 | $54,940 | |
Total Household Income | < 24K | 1807 (28%) | 10411 (22%) | 19432 (20%) |
25-49K | 1926 (30%) | 12351 (26%) | 23944 (25%) | |
50-74K | 1288 (20%) | 8949 (19%) | 19136 (20%) | |
75-99K | 639 (10%) | 5994 (12%) | 13309 (14%) | |
100-199K | 567 (9%) | 7688 (16%) | 16892 (17%) | |
200K+ | 50 (0%) | 967 (2%) | 2306 (2%) | |
Highest Education Level | No Diploma | 3226 | 28046 | 51914 |
Diploma or GED | 3421 | 29925 | 56876 | |
Some College | 2013 | 16065 | 35948 | |
Assoc. Degree | 608 | 5512 | 11512 | |
Bachelors Degree | 761 | 6304 | 16173 | |
Higher Degree | 251 | 2369 | 6236 | |
Total Housing Units | 6,765 | 51,572 | 105,125 | |
--Owner-Occupied | 2,436 | 23,730 | 47,207 | |
--Renter-Occupied | 3,841 | 22,630 | 47,811 | |
Owner-Occupied Values | < 100K | 1052 | 8940 | 14949 |
100-199K | 1136 | 11708 | 24064 | |
200-299K | 208 | 2338 | 6034 | |
300-399K | 30 | 480 | 1334 | |
400-499K | 2 | 97 | 473 | |
500K+ | 9 | 167 | 353 | |
Total Working Age Population | 13,000 | 110,459 | 221,698 | |
In Work Force | 8,638 | 73,011 | 149,127 | |
Not In Work Force | 4,362 | 37,448 | 72,571 | |
Workforce Employed | 7,619 | 65,956 | 135,923 | |
Workforce Unemployed | 1,019 | 7,052 | 13,020 | |
Civlian Workforce | 8,638 | 73,008 | 148,943 | |
Military Workforce | 0 | 3 | 185 | |
Total Households | 6,278 | 46,361 | 95,018 | |
Family Households | 4,146 | 35,215 | 70,304 | |
Non-Family Households | 2,131 | 11,146 | 24,714 | |
Married Couple | 2,326 | 22,866 | 45,361 | |
Other Family | 1,821 | 12,349 | 24,943 | |
Married w/Child | 1,081 | 11,180 | 22,073 | |
Single Male w/Child | 318 | 1,878 | 3,719 | |
Single Female w/Child | 919 | 5,461 | 10,129 |
Population Change Last Two Decades - Plus Projection
2000 | % | 2010 | % | 2020 | % | 2030 | |
---|---|---|---|---|---|---|---|
Texas | 20,851,820 | +21 | 25,145,561 | +18 | 29,677,668 | +18 | 34,894,452 |
Harris County | 3,400,578 | +20 | 4,092,459 | +22 | 4,978,845 | +19 | 5,924,750 |
Total Working Age Population:
Total Households:
Total Working Age Population:
Total Households:
Total Working Age Population:
Total Households: