Office Space
13020 Dairy Ashford Road Sugar Land, TX 77478
13020 Dairy Ashford Road Sugar Land, TX 77478
Details & Description
Property Highlights
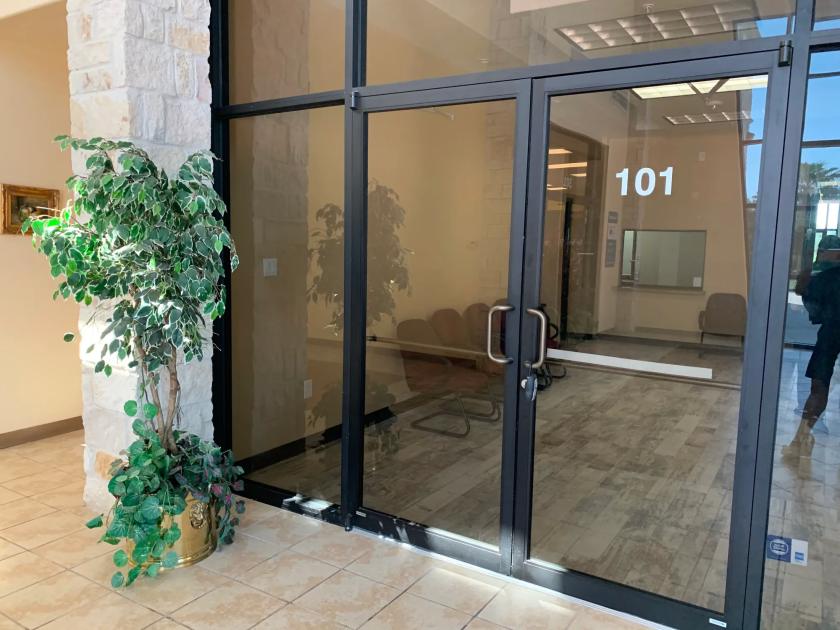
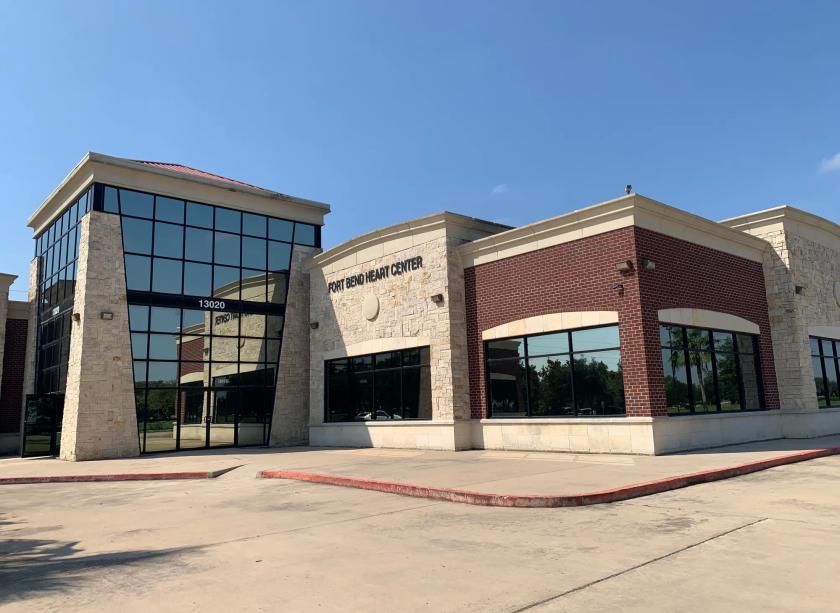
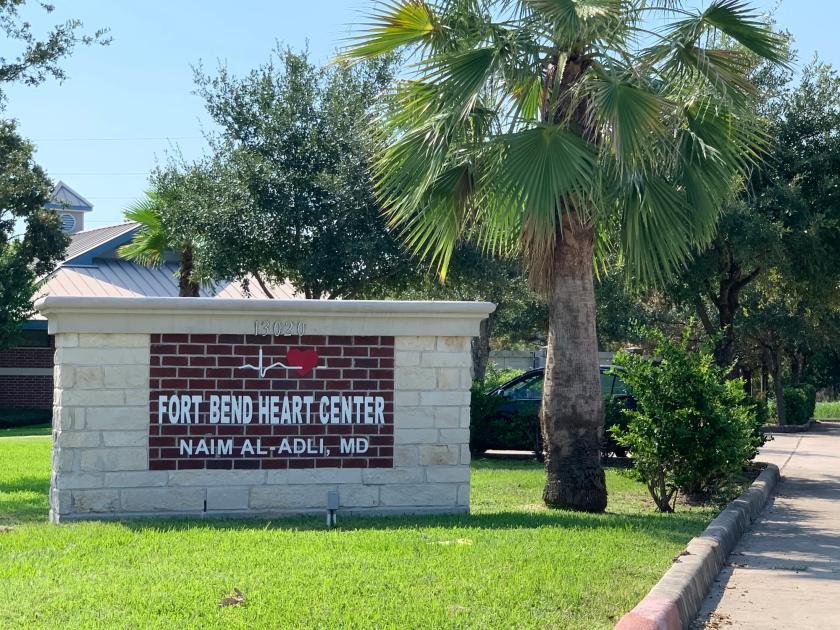
• Conveniently located at the entrance of Sugar Land Business Park
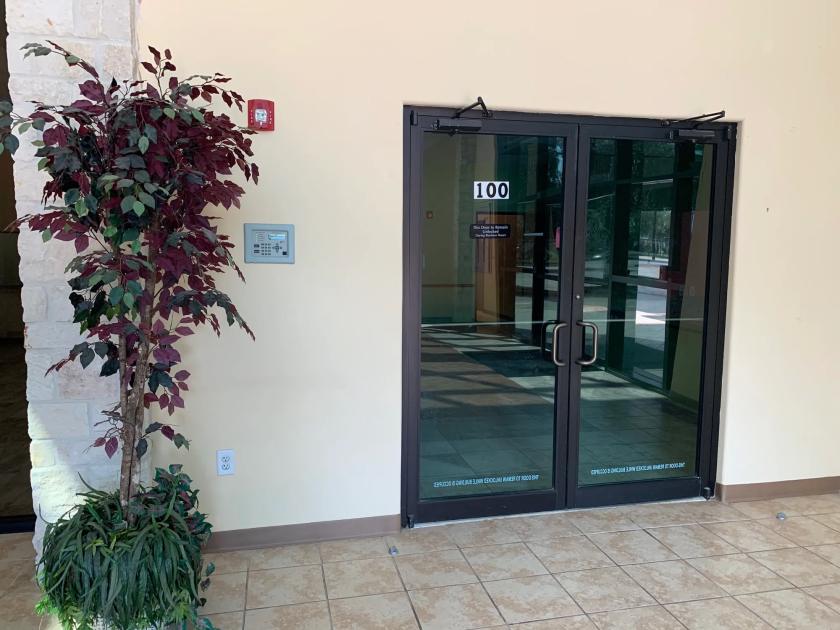
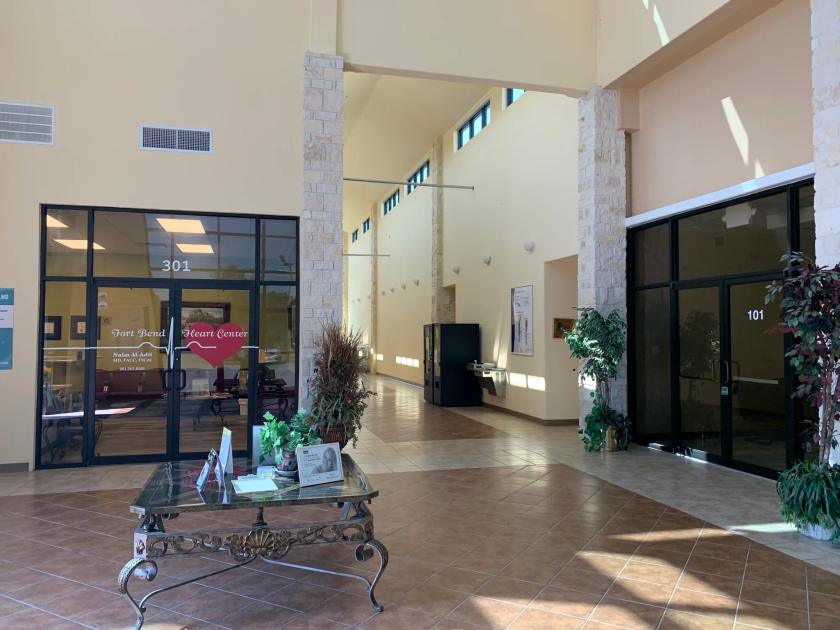
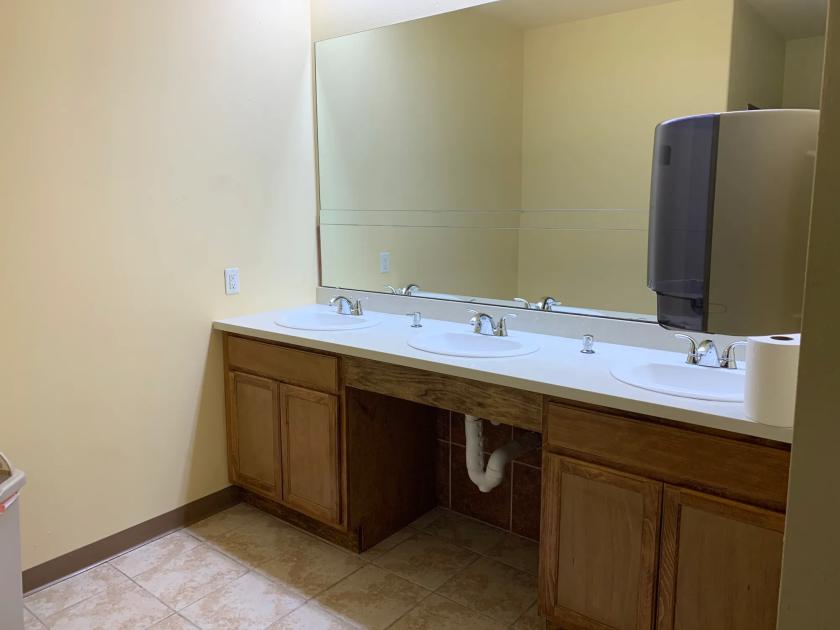
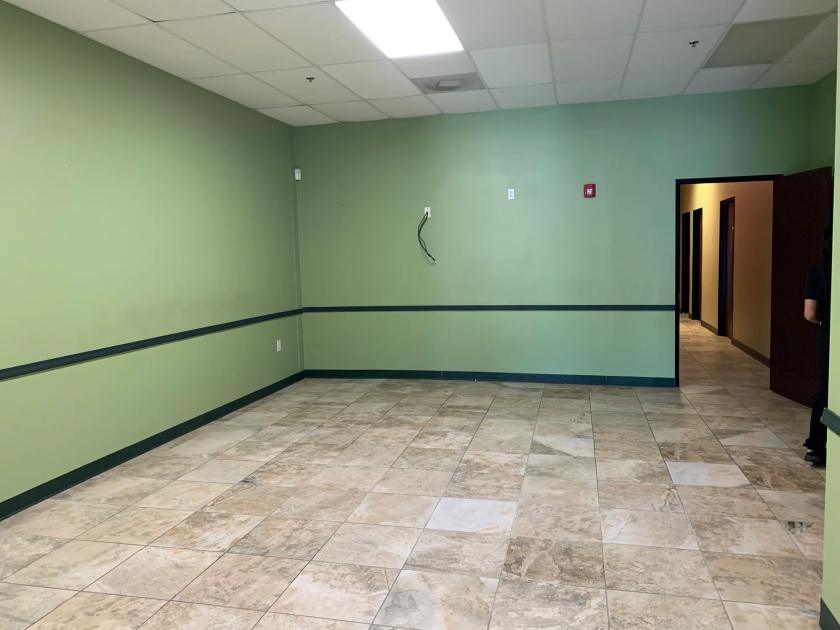
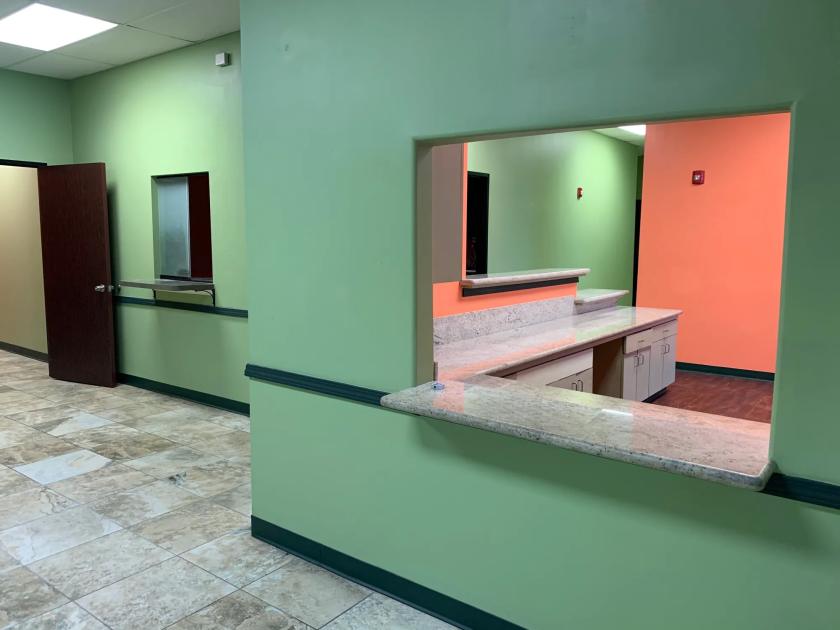
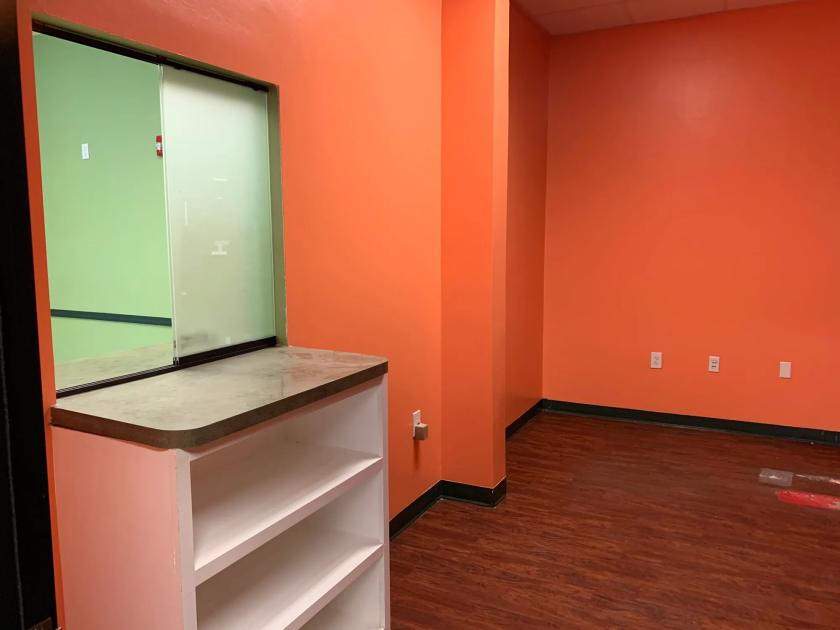
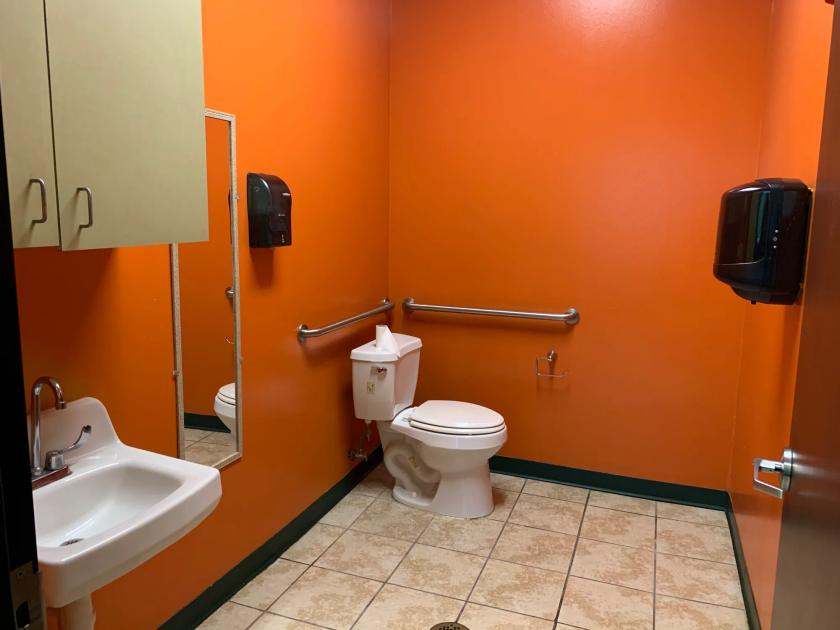
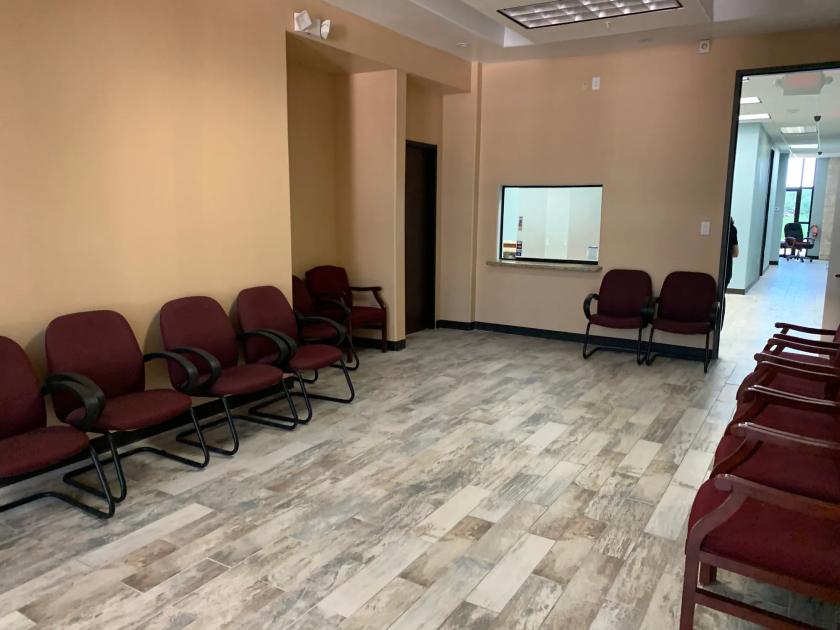
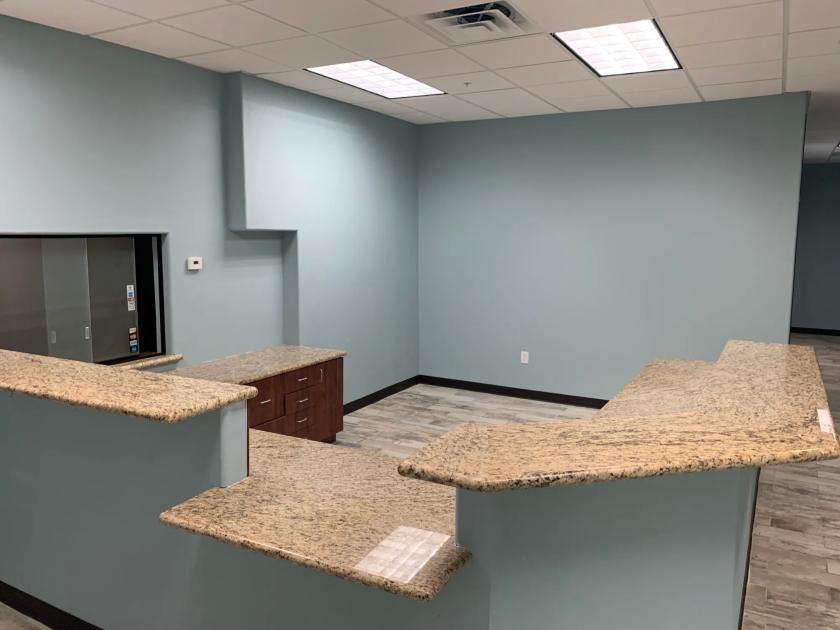
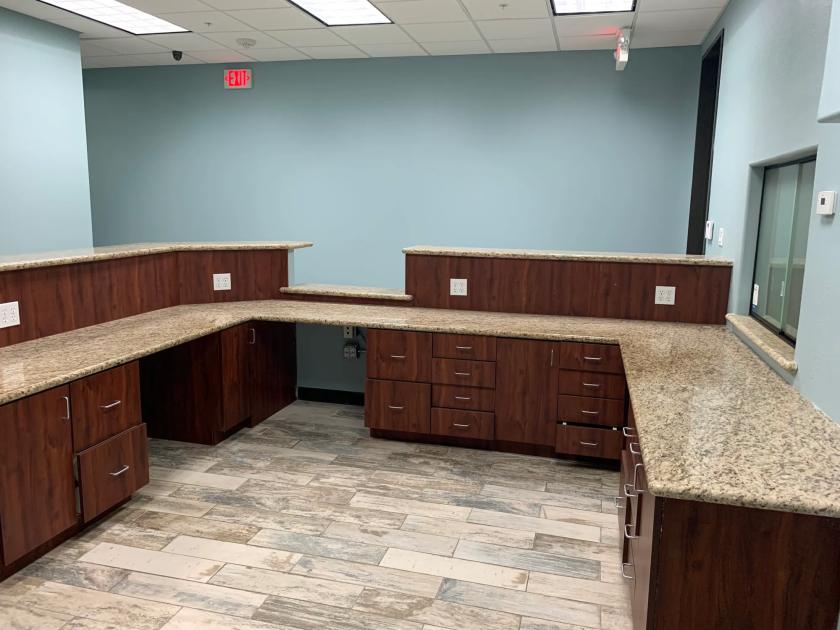
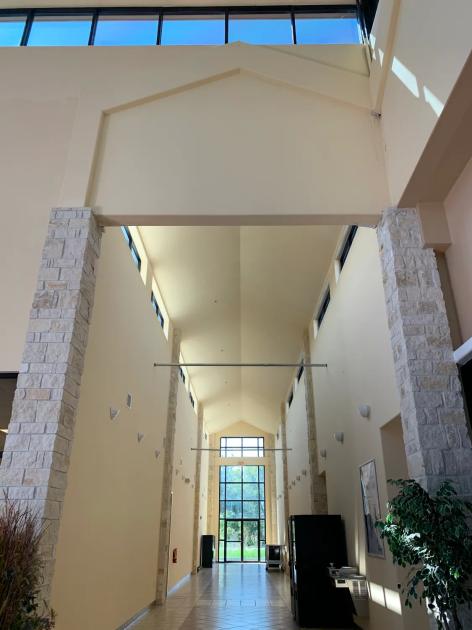
• Single-story medical & professional office building
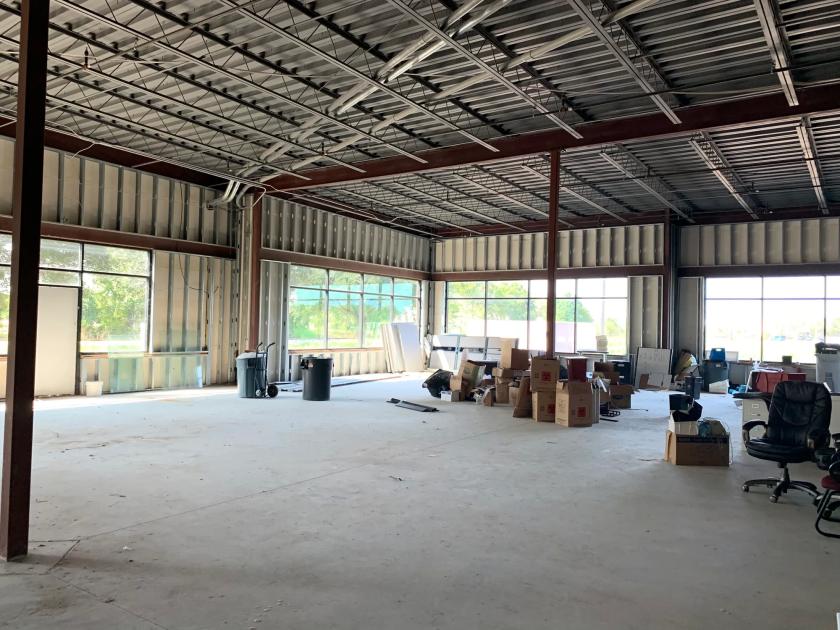
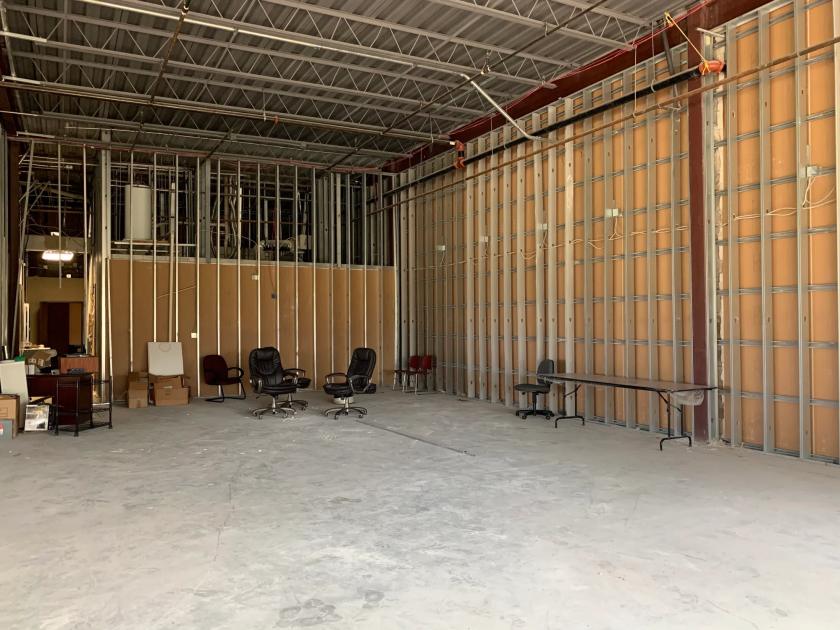
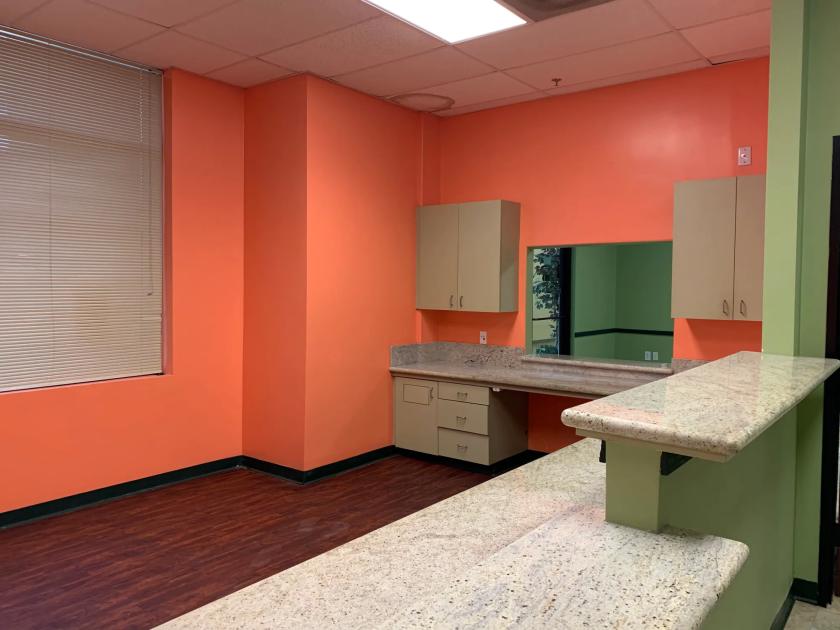
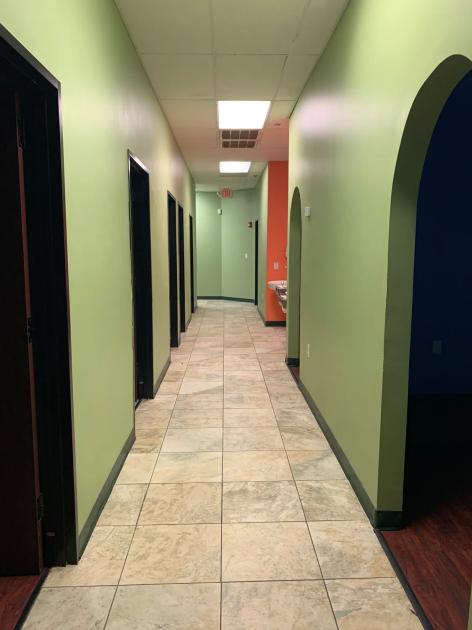
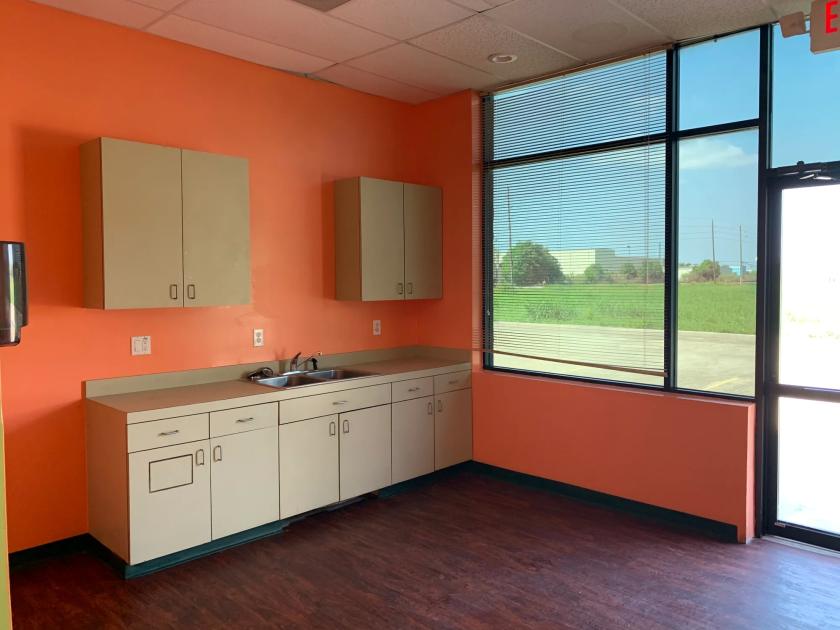
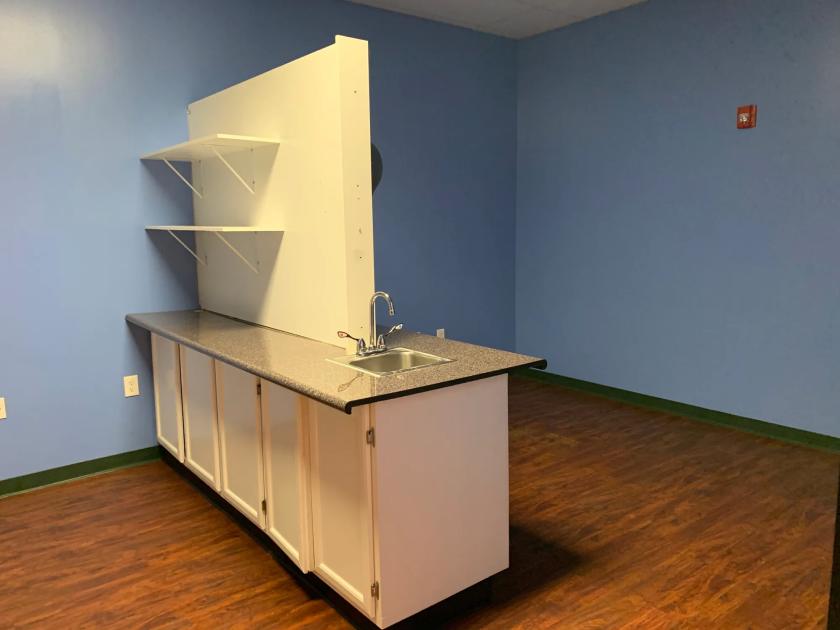
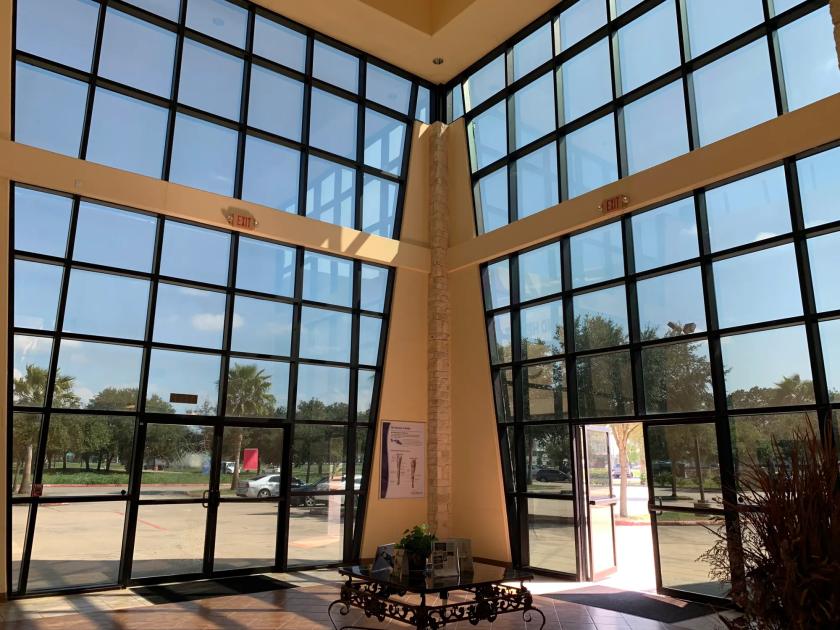
Additional Photos

Listing Agents

Nick Jasien
O: 713-325-5208
nick.jasien@freg.com
O: 713-325-5208
nick.jasien@freg.com

Neha Abassi
O: 713-353-0351
M: 832-868-0303
neha.abassi@freg.com
O: 713-353-0351
M: 832-868-0303
neha.abassi@freg.com
While we strive to provide the most accurate information, all listing information, and demographic data, is provided by third-parties. As such, MyEListing will not be responsible for the accuracy of the information. It is strongly recommended that you verify all information with the listing agent, and any relevant agencies, prior to making any decisions.