Office Space
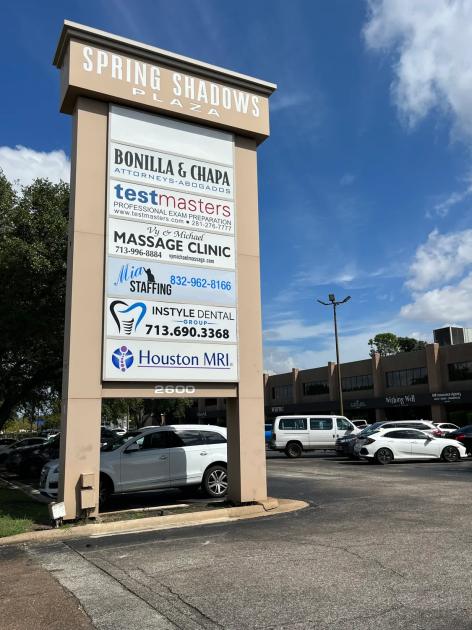
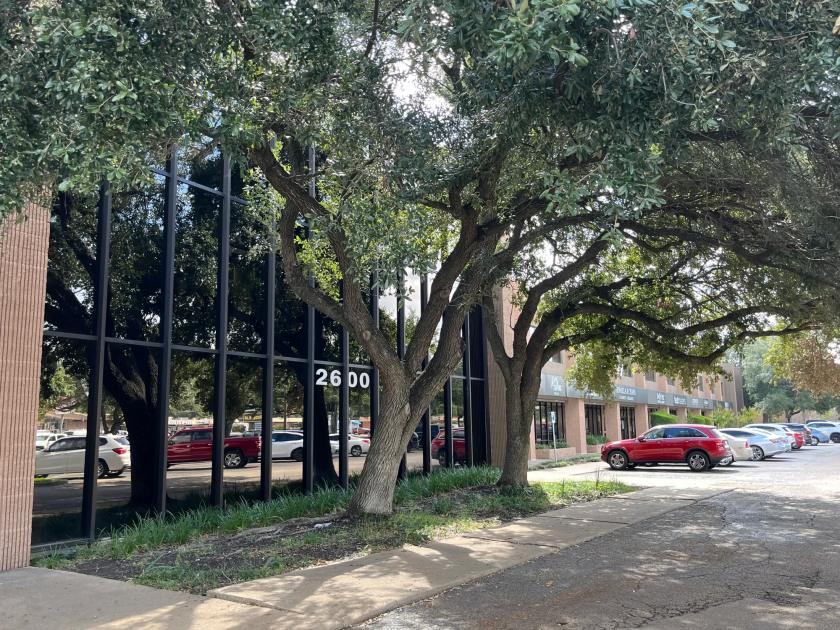
2600 Gessner Road Houston, TX 77080
2600 Gessner Road Houston, TX 77080
Details & Description
Property Highlights
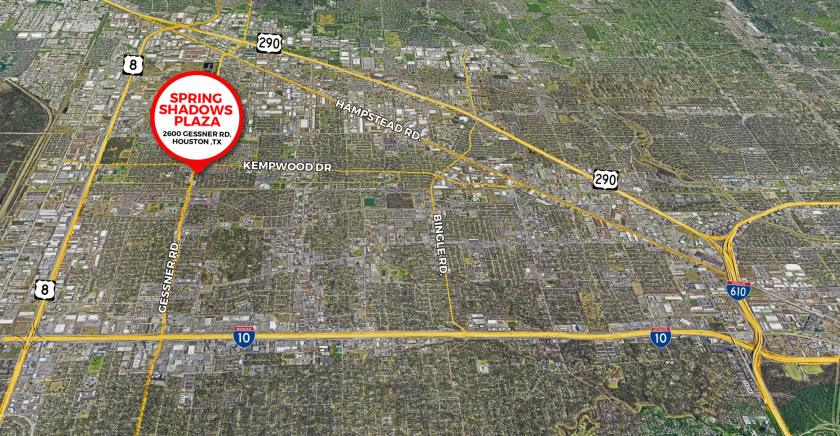
- • Signalized Intersection
- • 1.37 miles to Beltway 8
- • 2.3 miles to I-10 (Memorial City)
- • 3.25 miles to Highway 290
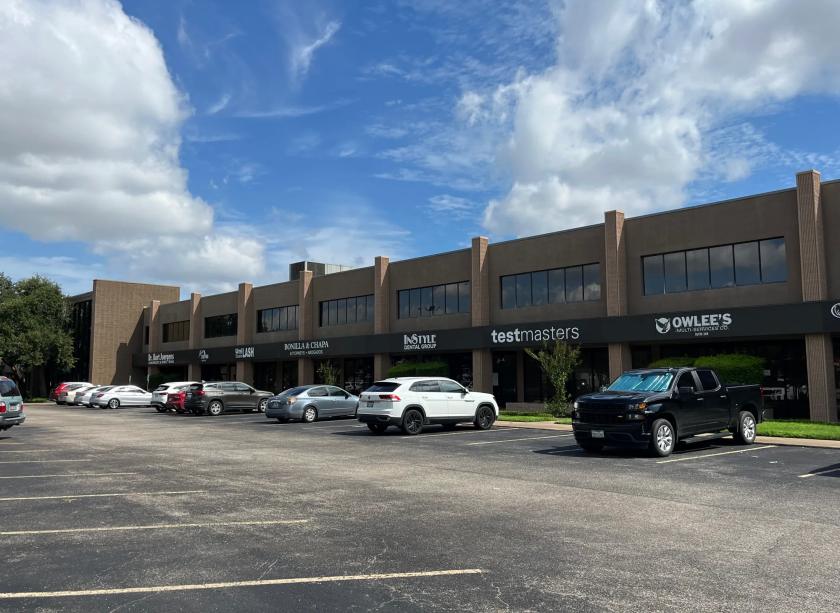
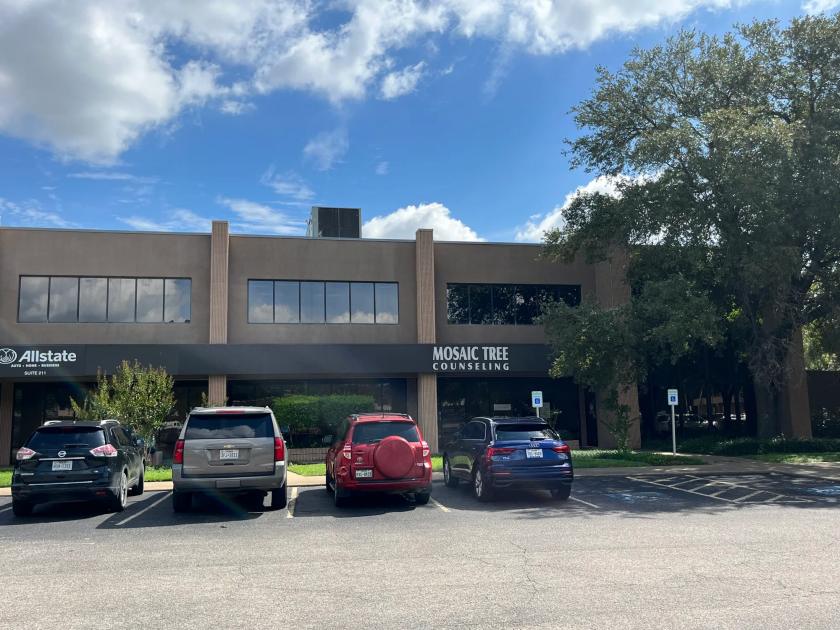
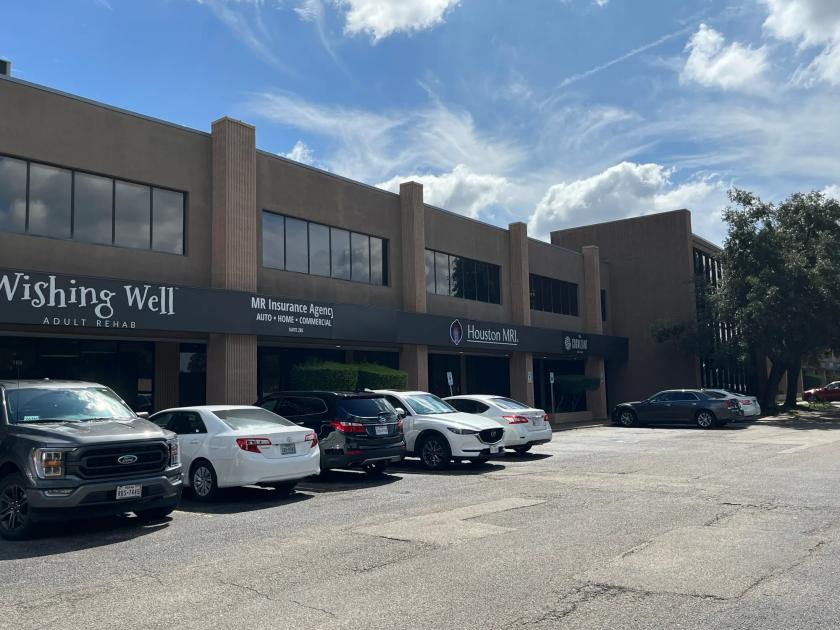
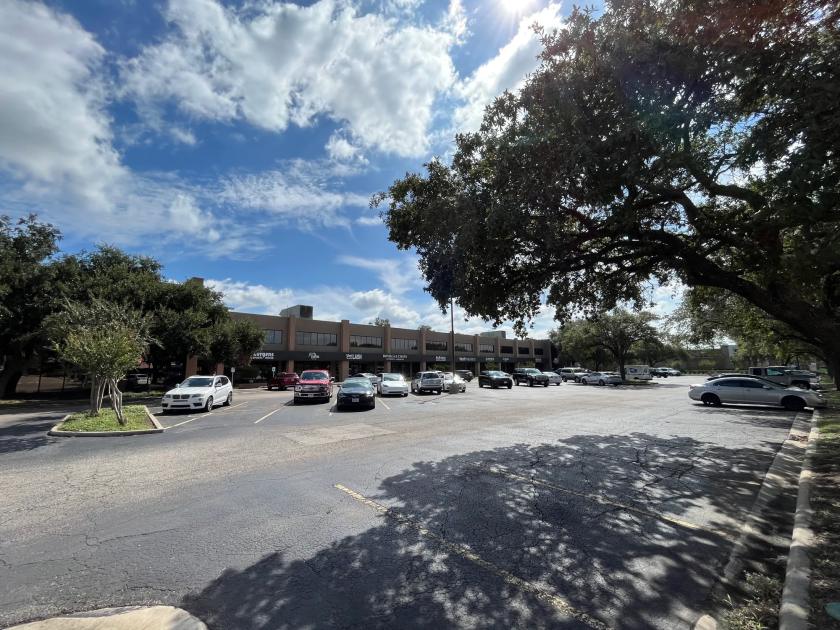
Additional Photos
Listing Agents

Nick Jasien
O: 713-325-5208
nick.jasien@freg.com
O: 713-325-5208
nick.jasien@freg.com
While we strive to provide the most accurate information, all listing information, and demographic data, is provided by third-parties. As such, MyEListing will not be responsible for the accuracy of the information. It is strongly recommended that you verify all information with the listing agent, and any relevant agencies, prior to making any decisions.