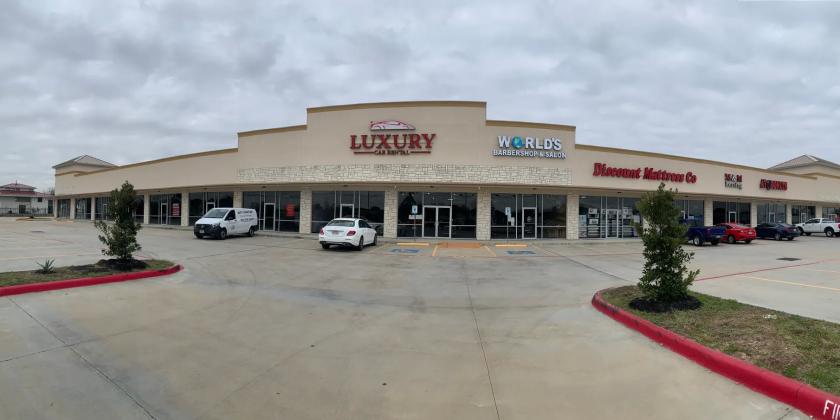
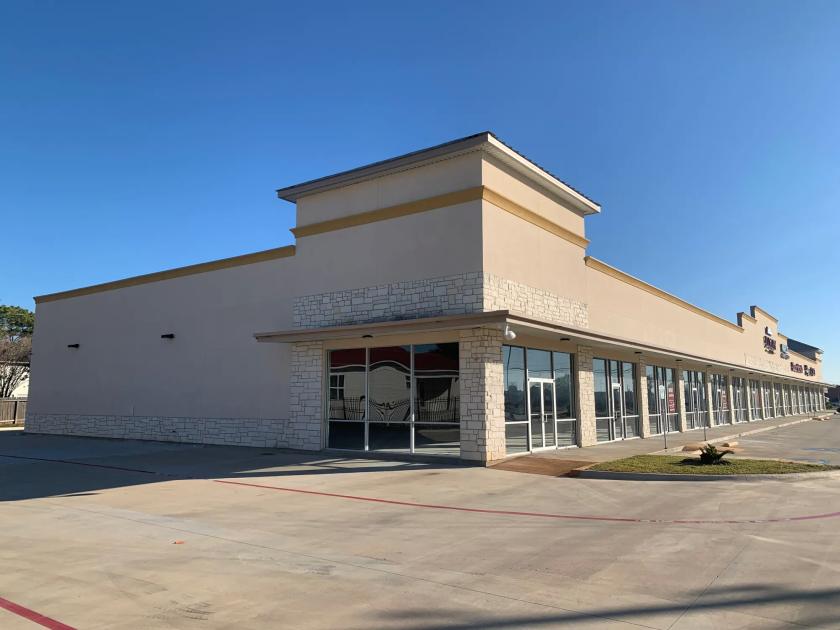
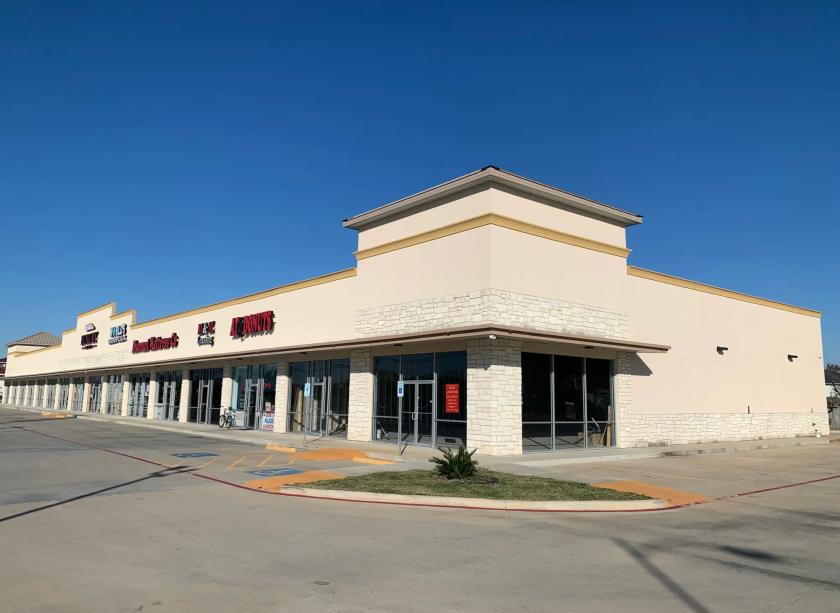
1-Mile | 3-Miles | 5-Miles | ||
---|---|---|---|---|
Total Population | 18,531 | 132,308 | 292,051 | |
Population Median Age | 33 | 33 | 33 | |
Population by Age | 0-9 Yrs | 2872 (15%) | 22127 (16%) | 46276 (15%) |
10-19 Yrs | 3518 (18%) | 21001 (15%) | 47955 (16%) | |
20-29 Yrs | 1691 (9%) | 16858 (12%) | 38069 (13%) | |
30-39 Yrs | 2995 (16%) | 21218 (16%) | 47001 (16%) | |
40-49 Yrs | 2645 (14%) | 19846 (14%) | 41174 (14%) | |
50-59 Yrs | 3021 (16%) | 15390 (11%) | 33260 (11%) | |
60-69 Yrs | 1222 (6%) | 10226 (7%) | 24274 (8%) | |
70+ Yrs | 567 (3%) | 5642 (4%) | 14041 (4%) | |
Median HH Income | $70,363 | $76,366 | $76,023 | |
Total Household Income | < 24K | 295 (5%) | 3422 (8%) | 8759 (9%) |
25-49K | 1070 (18%) | 7215 (18%) | 17858 (19%) | |
50-74K | 1820 (32%) | 8990 (22%) | 18652 (20%) | |
75-99K | 593 (10%) | 7187 (17%) | 14598 (15%) | |
100-199K | 1522 (27%) | 11440 (28%) | 26626 (29%) | |
200K+ | 333 (5%) | 1786 (4%) | 5241 (5%) | |
Highest Education Level | No Diploma | 1265 | 11765 | 24835 |
Diploma or GED | 2420 | 18723 | 39518 | |
Some College | 3466 | 19594 | 40452 | |
Assoc. Degree | 1051 | 8109 | 17002 | |
Bachelors Degree | 2268 | 16584 | 41813 | |
Higher Degree | 916 | 6432 | 16137 | |
Total Housing Units | 5,706 | 41,680 | 96,963 | |
--Owner-Occupied | 3,969 | 28,318 | 61,643 | |
--Renter-Occupied | 1,664 | 11,723 | 30,090 | |
Owner-Occupied Values | < 100K | 225 | 1644 | 3677 |
100-199K | 2626 | 18194 | 35126 | |
200-299K | 1080 | 7812 | 16389 | |
300-399K | 28 | 464 | 3804 | |
400-499K | 0 | 67 | 1245 | |
500K+ | 10 | 137 | 1401 | |
Total Working Age Population | 13,163 | 95,865 | 214,326 | |
In Work Force | 9,977 | 70,806 | 153,575 | |
Not In Work Force | 3,186 | 25,059 | 60,751 | |
Workforce Employed | 9,640 | 66,183 | 144,482 | |
Workforce Unemployed | 336 | 4,601 | 9,001 | |
Civlian Workforce | 9,977 | 70,783 | 153,483 | |
Military Workforce | 0 | 22 | 92 | |
Total Households | 5,633 | 40,041 | 91,733 | |
Family Households | 4,865 | 32,322 | 72,458 | |
Non-Family Households | 768 | 7,719 | 19,275 | |
Married Couple | 3,481 | 23,096 | 51,717 | |
Other Family | 1,384 | 9,226 | 20,741 | |
Married w/Child | 2,011 | 12,772 | 27,649 | |
Single Male w/Child | 106 | 1,084 | 2,384 | |
Single Female w/Child | 555 | 4,032 | 8,854 |
Population Change Last Two Decades - Plus Projection
2000 | % | 2010 | % | 2020 | % | 2030 | |
---|---|---|---|---|---|---|---|
Texas | 20,851,820 | +21 | 25,145,561 | +18 | 29,677,668 | +18 | 34,894,452 |
Harris County | 3,400,578 | +20 | 4,092,459 | +22 | 4,978,845 | +19 | 5,924,750 |
Total Working Age Population:
Total Households:
Total Working Age Population:
Total Households:
Total Working Age Population:
Total Households: