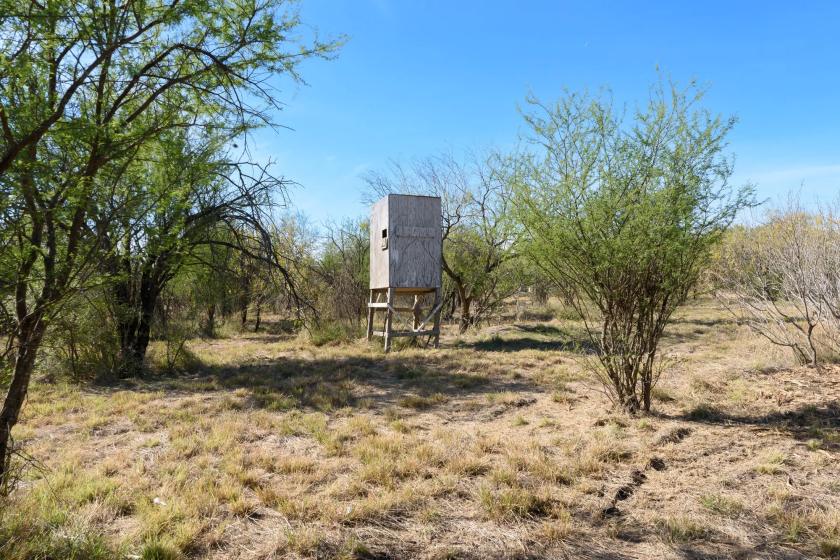
Commercial Land
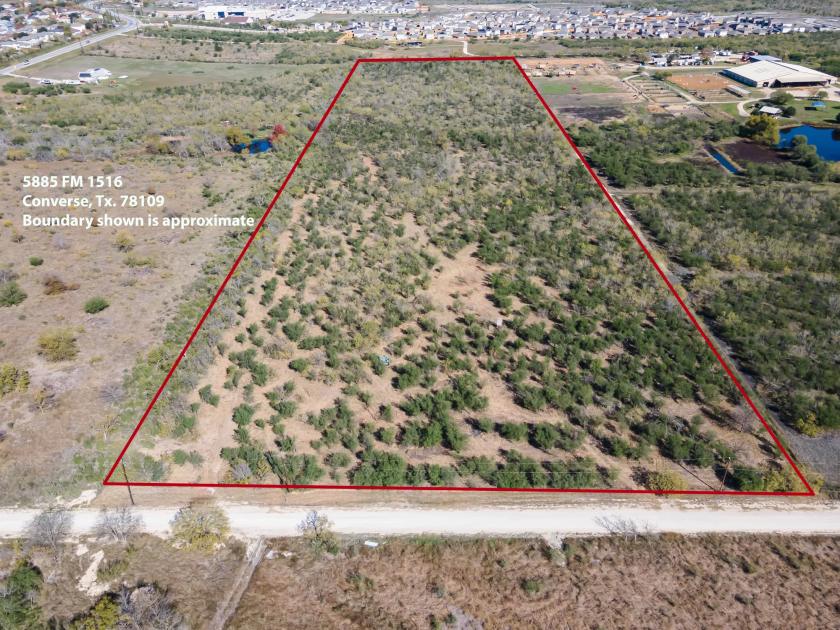
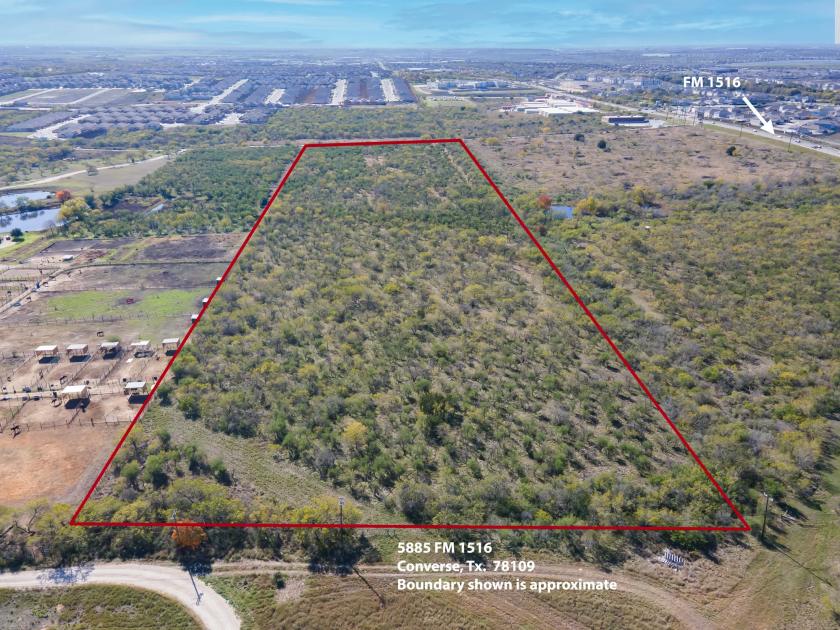
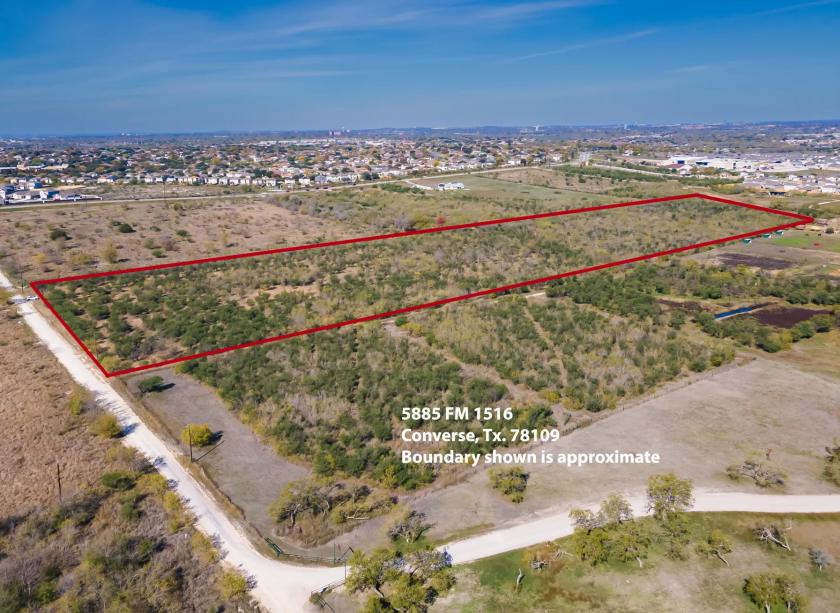
5885 Farm to Market 1516 Converse, TX 78109
5885 Farm to Market 1516 Converse, TX 78109
Details & Description
Property Highlights
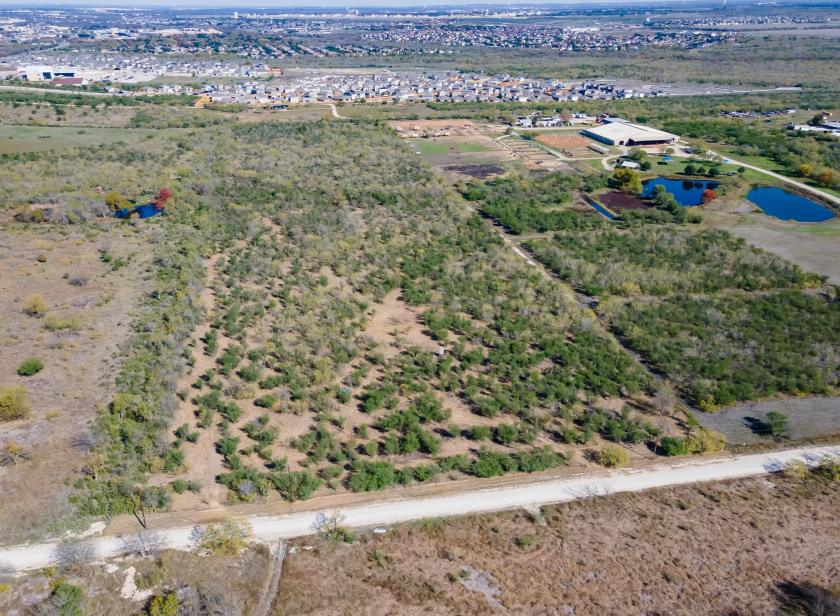
- • Close to I-10 & Loop 1604
- • Close to lots of new developments
- • Good traffic counts in the area
- • Major Road expansions near the property
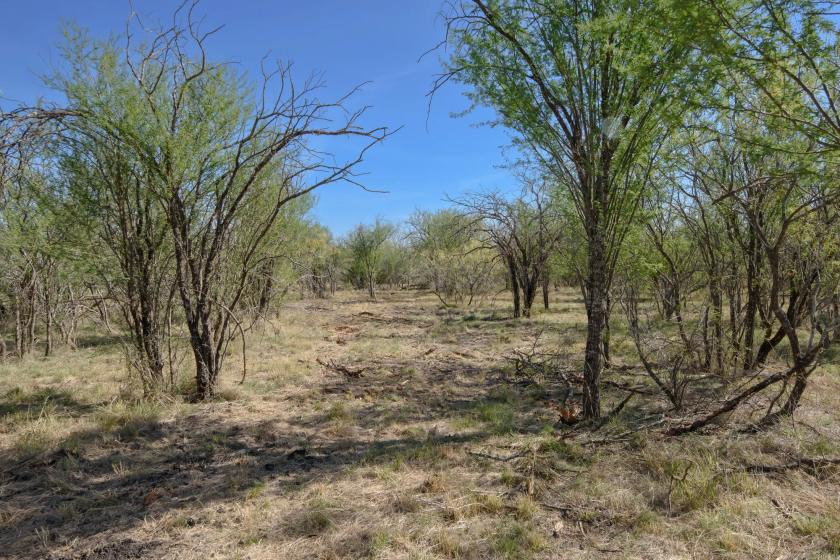
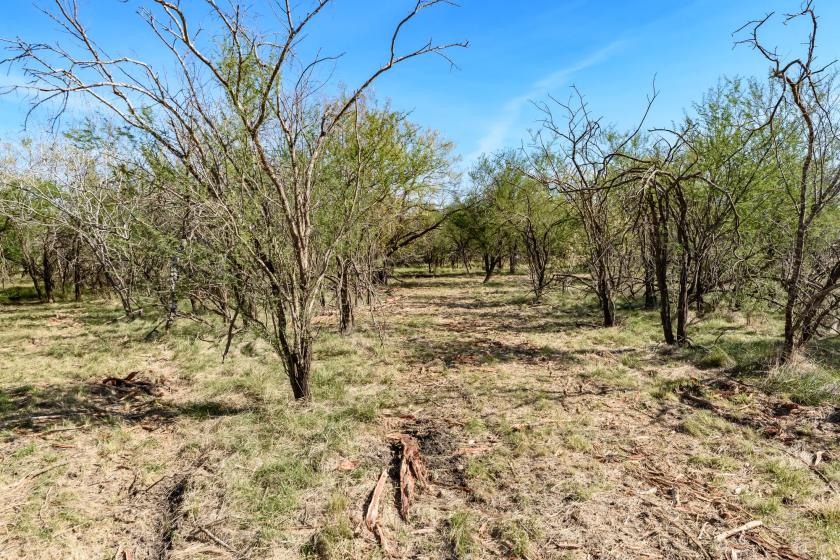
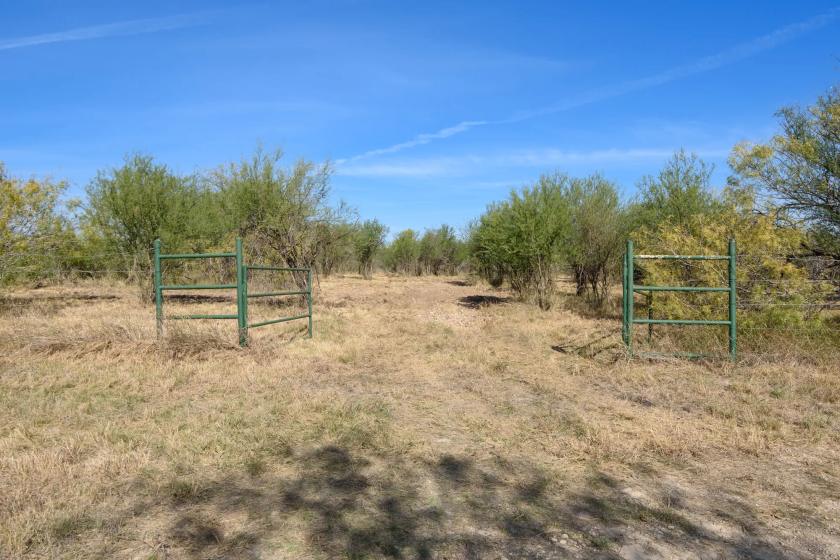
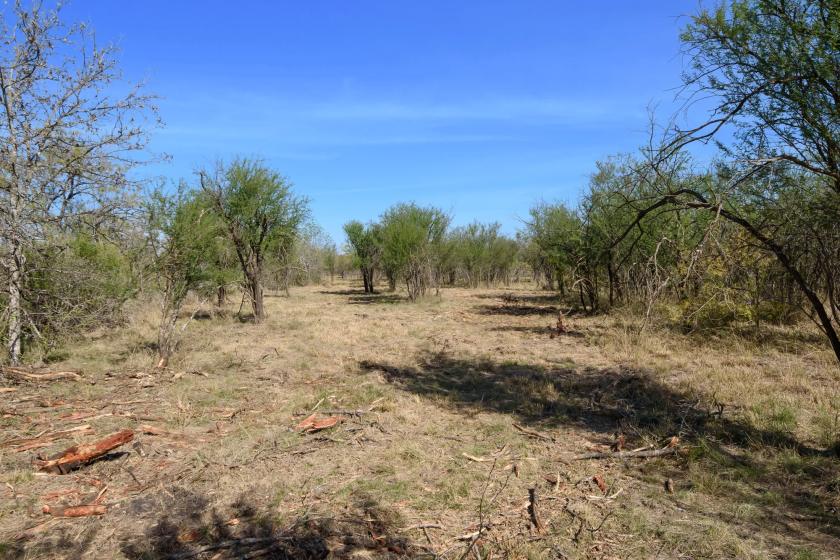
Additional Photos
Listing Agents

Mark Haynie
O: 830-481-9533
M: 830-481-9533
mark.haynie@sperrycga.com
O: 830-481-9533
M: 830-481-9533
mark.haynie@sperrycga.com
While we strive to provide the most accurate information, all listing information, and demographic data, is provided by third-parties. As such, MyEListing will not be responsible for the accuracy of the information. It is strongly recommended that you verify all information with the listing agent, and any relevant agencies, prior to making any decisions.