Commercial Land
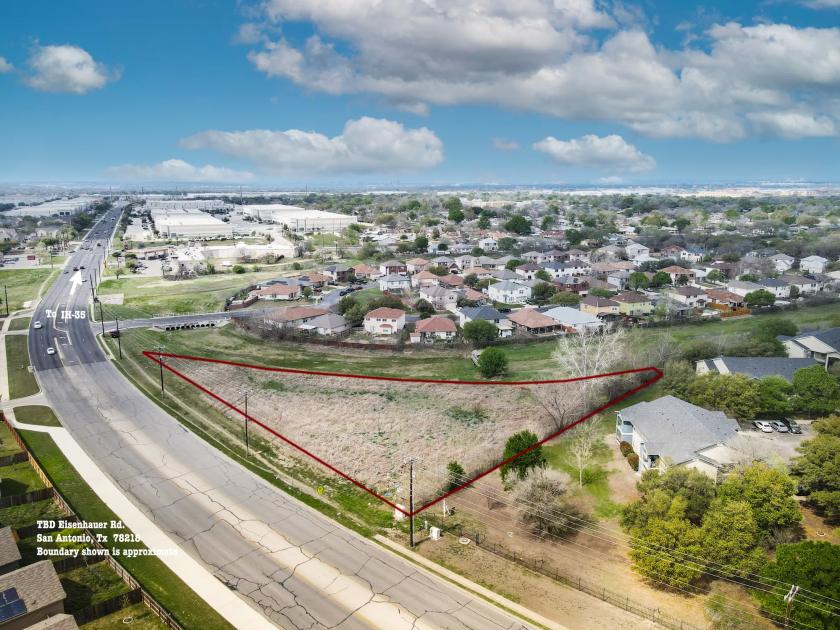
00 Eisenhauer Rd San Antonio, TX 78218
00 Eisenhauer Rd San Antonio, TX 78218
Details & Description
Property Highlights
- • Zoned c2
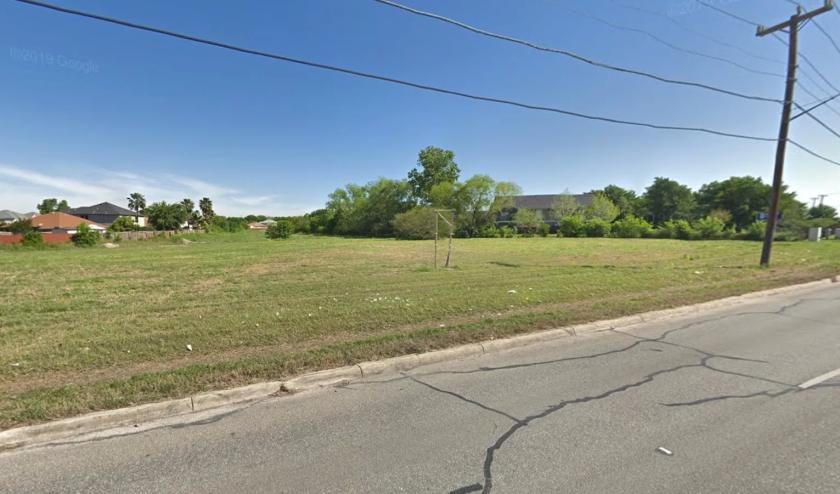
- • Utilities available at street
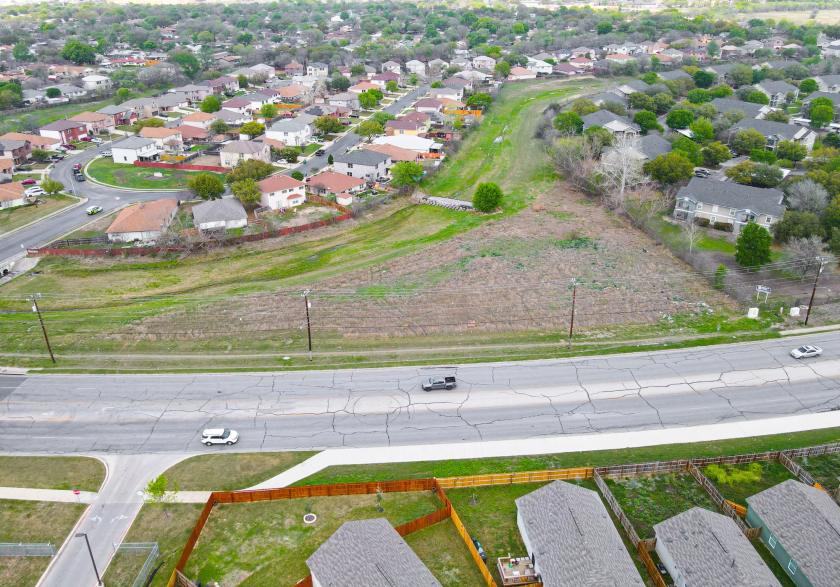
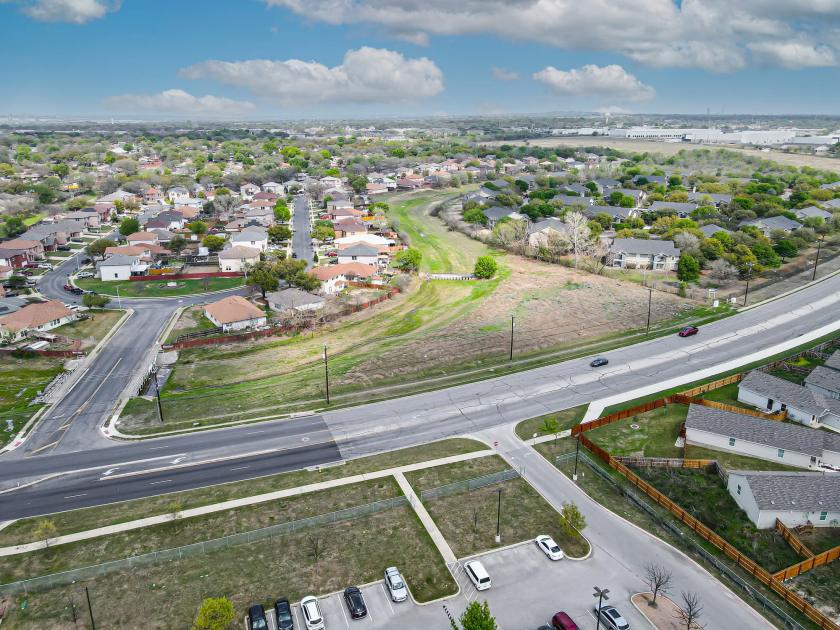
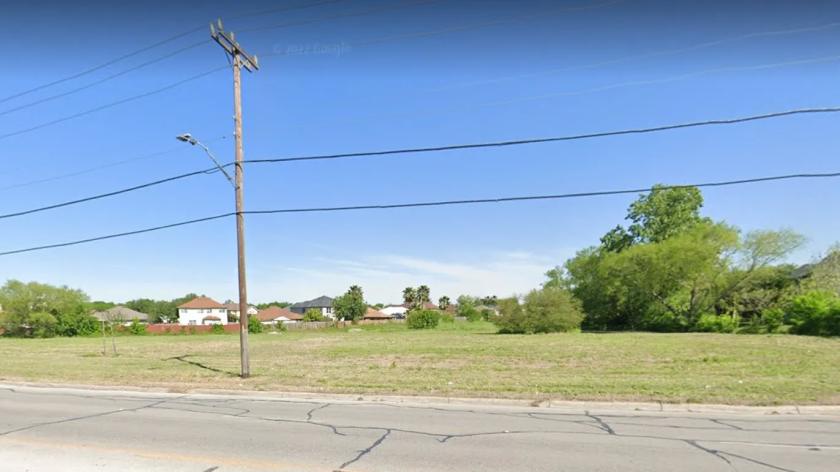
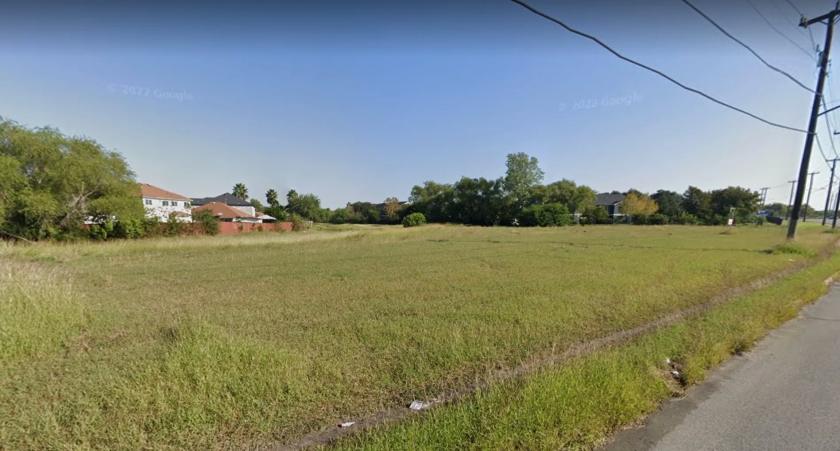
- • Level and cleared
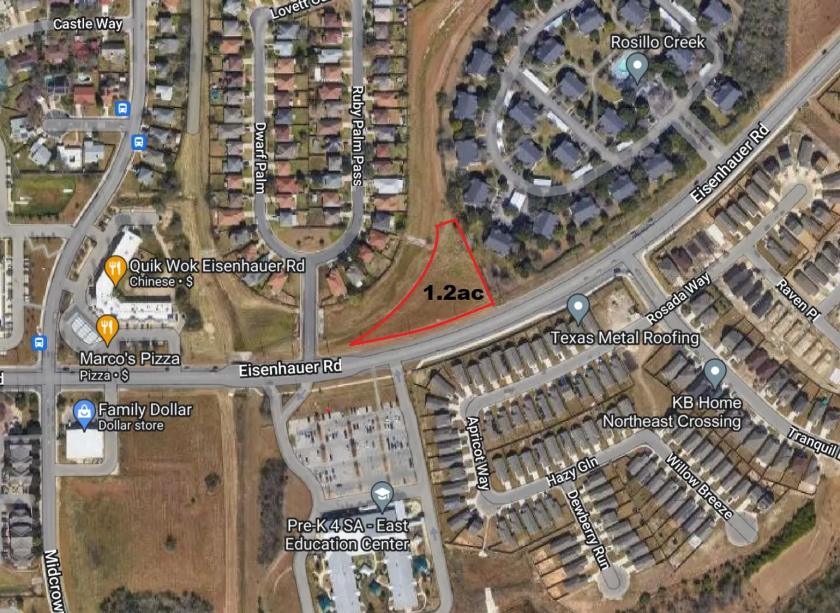
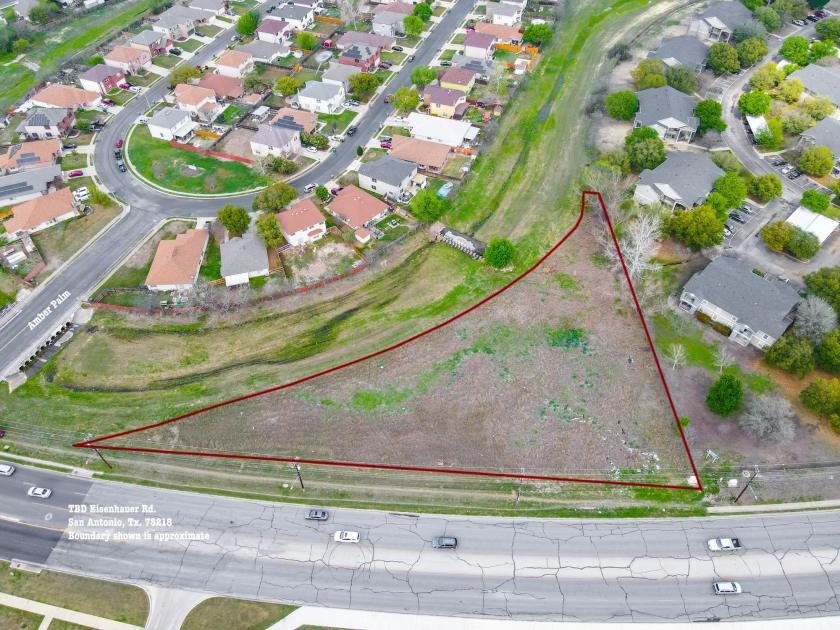
- • 420 ft of frontage on Eisenhauer
Additional Photos
Listing Agents

Mark Haynie
O: 830-481-9533
M: 830-481-9533
mark.haynie@sperrycga.com
O: 830-481-9533
M: 830-481-9533
mark.haynie@sperrycga.com
While we strive to provide the most accurate information, all listing information, and demographic data, is provided by third-parties. As such, MyEListing will not be responsible for the accuracy of the information. It is strongly recommended that you verify all information with the listing agent, and any relevant agencies, prior to making any decisions.