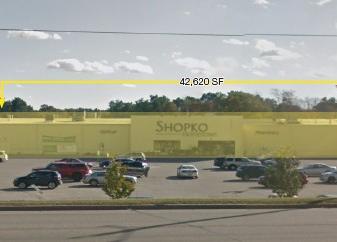
Industrial Properties
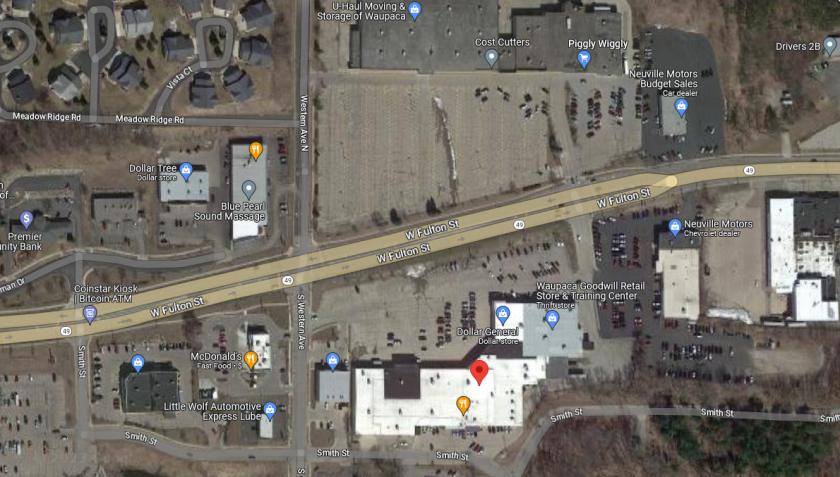
825 West Fulton Street Waupaca, WI 54981
825 West Fulton Street Waupaca, WI 54981
Details & Description
Property Highlights
- • Pylon Signage
- • Near highway interchange
- • Ample parking
- • Located in th CIty of Waupaca
Listing Agents

Amy Pfefferle Oelhafen
O: 920-968-4700
M: 920-560-5009
amyo@naipfefferle.com
O: 920-968-4700
M: 920-560-5009
amyo@naipfefferle.com
While we strive to provide the most accurate information, all listing information, and demographic data, is provided by third-parties. As such, MyEListing will not be responsible for the accuracy of the information. It is strongly recommended that you verify all information with the listing agent, and any relevant agencies, prior to making any decisions.