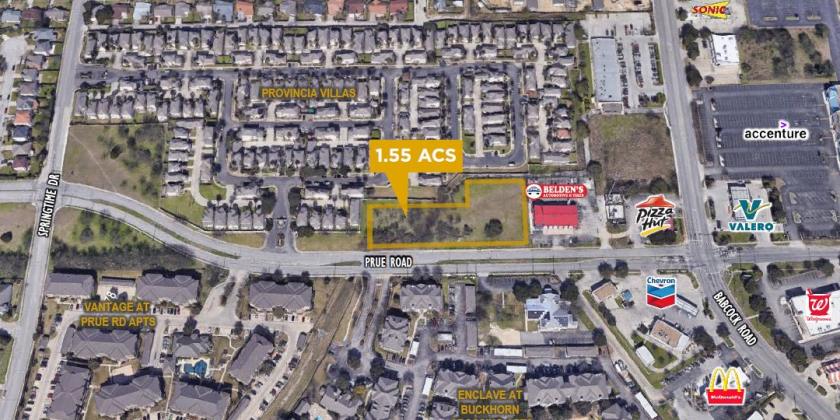
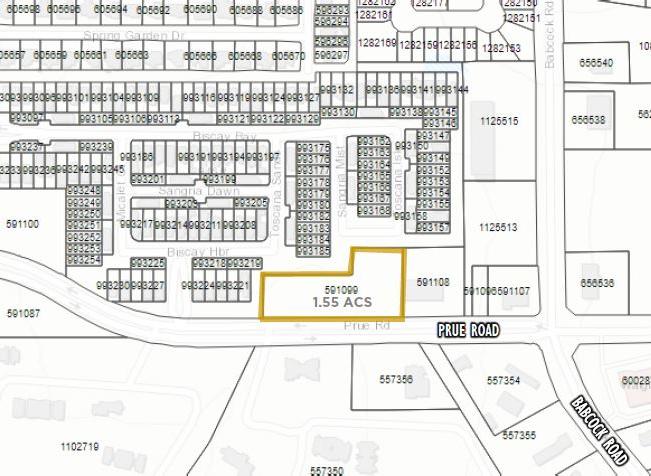
1-Mile | 3-Miles | 5-Miles | ||
---|---|---|---|---|
Total Population | 15,715 | 137,805 | 326,765 | |
Population Median Age | 36 | 34 | 35 | |
Population by Age | 0-9 Yrs | 1982 (12%) | 17035 (12%) | 41636 (12%) |
10-19 Yrs | 1568 (9%) | 17333 (12%) | 41687 (12%) | |
20-29 Yrs | 3589 (22%) | 33050 (23%) | 66440 (20%) | |
30-39 Yrs | 2324 (14%) | 21929 (15%) | 49991 (15%) | |
40-49 Yrs | 1808 (11%) | 14752 (10%) | 37822 (11%) | |
50-59 Yrs | 1731 (11%) | 13608 (9%) | 34805 (10%) | |
60-69 Yrs | 1461 (9%) | 10561 (7%) | 28772 (8%) | |
70+ Yrs | 1252 (7%) | 9537 (6%) | 25612 (7%) | |
Median HH Income | $72,510 | $64,195 | $65,239 | |
Total Household Income | < 24K | 862 (15%) | 8856 (17%) | 20216 (17%) |
25-49K | 1053 (18%) | 10373 (20%) | 24300 (20%) | |
50-74K | 981 (17%) | 9390 (18%) | 21804 (18%) | |
75-99K | 804 (14%) | 6839 (13%) | 15422 (13%) | |
100-199K | 1491 (26%) | 11813 (23%) | 28491 (24%) | |
200K+ | 391 (7%) | 2376 (4%) | 6531 (5%) | |
Highest Education Level | No Diploma | 592 | 5930 | 16110 |
Diploma or GED | 2310 | 15924 | 39605 | |
Some College | 2776 | 19752 | 49501 | |
Assoc. Degree | 979 | 8042 | 19313 | |
Bachelors Degree | 2350 | 23059 | 53576 | |
Higher Degree | 1503 | 14413 | 33129 | |
Total Housing Units | 5,895 | 54,229 | 126,356 | |
--Owner-Occupied | 3,619 | 21,807 | 59,203 | |
--Renter-Occupied | 1,963 | 27,840 | 57,561 | |
Owner-Occupied Values | < 100K | 287 | 888 | 3150 |
100-199K | 1870 | 9761 | 25654 | |
200-299K | 1161 | 8731 | 19793 | |
300-399K | 217 | 1765 | 6514 | |
400-499K | 32 | 319 | 1629 | |
500K+ | 52 | 343 | 2463 | |
Total Working Age Population | 12,815 | 111,911 | 261,434 | |
In Work Force | 9,702 | 80,047 | 182,134 | |
Not In Work Force | 3,113 | 31,864 | 79,299 | |
Workforce Employed | 8,937 | 74,632 | 171,237 | |
Workforce Unemployed | 693 | 4,882 | 9,602 | |
Civlian Workforce | 9,630 | 79,514 | 180,839 | |
Military Workforce | 71 | 533 | 1,296 | |
Total Households | 5,582 | 49,648 | 116,764 | |
Family Households | 3,372 | 28,022 | 70,278 | |
Non-Family Households | 2,209 | 21,626 | 46,485 | |
Married Couple | 2,384 | 19,450 | 50,095 | |
Other Family | 988 | 8,572 | 20,184 | |
Married w/Child | 938 | 8,614 | 21,458 | |
Single Male w/Child | 70 | 1,007 | 2,312 | |
Single Female w/Child | 331 | 3,100 | 7,630 |
Population Change Last Two Decades - Plus Projection
2000 | % | 2010 | % | 2020 | % | 2030 | |
---|---|---|---|---|---|---|---|
Texas | 20,851,820 | +21 | 25,145,561 | +18 | 29,677,668 | +18 | 34,894,452 |
Bexar County | 1,392,931 | +23 | 1,714,773 | +22 | 2,093,502 | +20 | 2,502,617 |
Total Working Age Population:
Total Households:
Total Working Age Population:
Total Households:
Total Working Age Population:
Total Households: