Commercial Land
NWC I-37 and Loop 1604 S San Antonio, TX 78264
NWC I-37 and Loop 1604 S San Antonio, TX 78264
Details & Description
Property Highlights
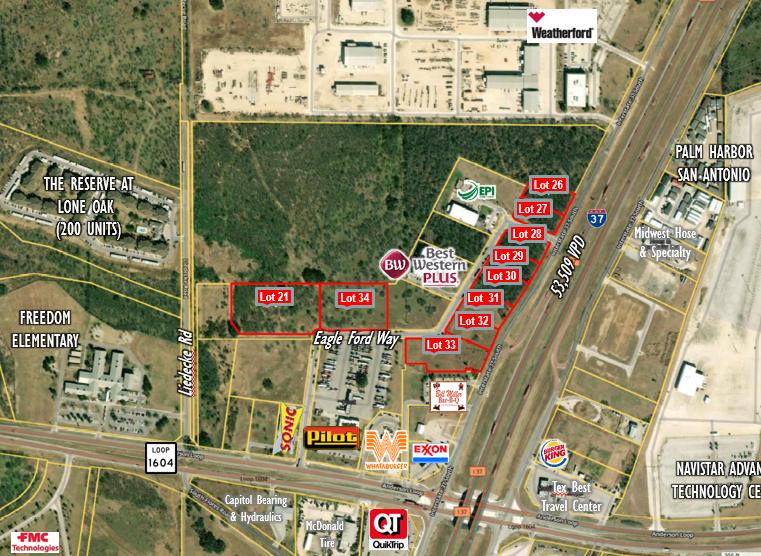
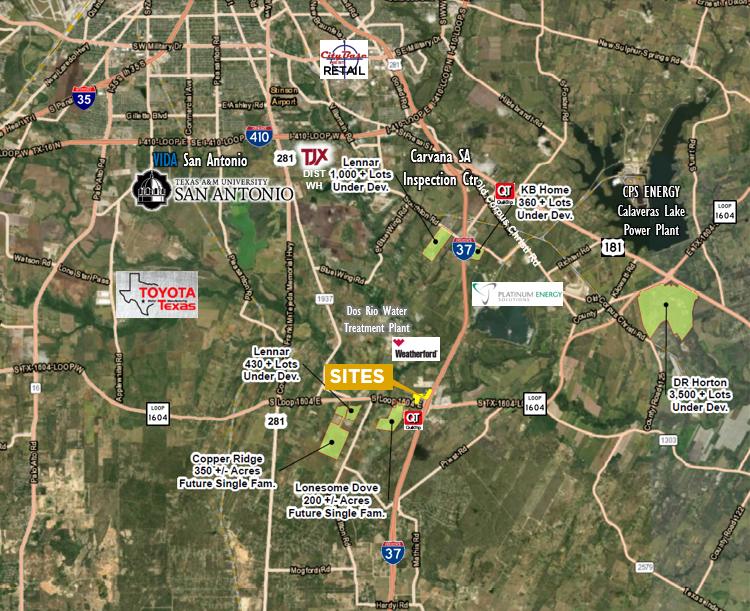
• Convenient access to IH-37 & Hwy 281, major employers, schools, and south San Antonio retail
• Near public schools, new subdivisions planned in immediate aree
Additional Photos
Listing Agents

Zach Davis
O: 210-341-9292
zdavis@sullivansa.com
O: 210-341-9292
zdavis@sullivansa.com
While we strive to provide the most accurate information, all listing information, and demographic data, is provided by third-parties. As such, MyEListing will not be responsible for the accuracy of the information. It is strongly recommended that you verify all information with the listing agent, and any relevant agencies, prior to making any decisions.


