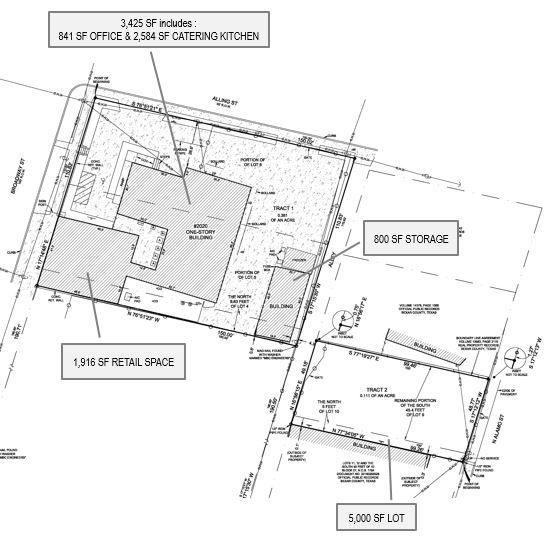
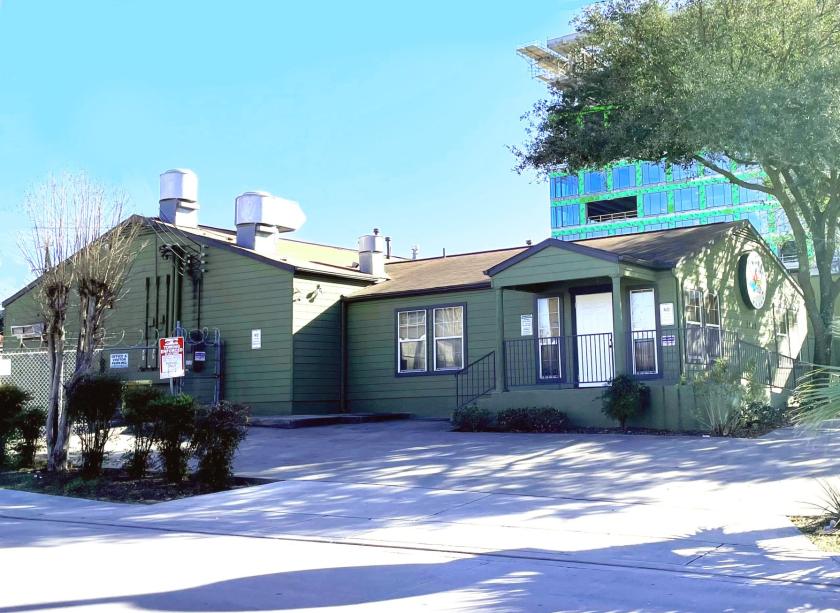
Retail Space
2020 Broadway San Antonio, TX 78215
2020 Broadway San Antonio, TX 78215
Details & Description
Property Highlights
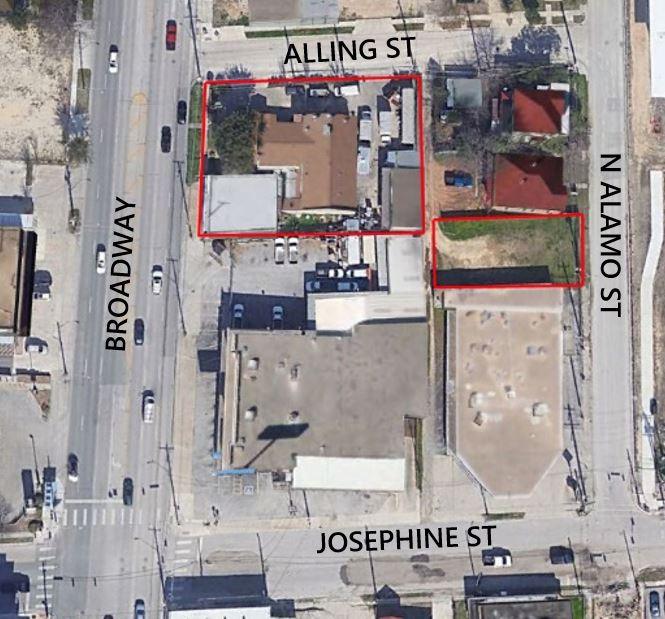
• NC Submarket – Directly off Broadway, just north of Josephine St, within the Pearl District
• Quick access to all major thoroughfares
Listing Agents

Pete Tassos
O: 210-341-9292
ptassos@sullivansa.com
O: 210-341-9292
ptassos@sullivansa.com
While we strive to provide the most accurate information, all listing information, and demographic data, is provided by third-parties. As such, MyEListing will not be responsible for the accuracy of the information. It is strongly recommended that you verify all information with the listing agent, and any relevant agencies, prior to making any decisions.