Commercial Land
2311 N Abbott Rd Saint Hedwig, TX 78152
2311 N Abbott Rd Saint Hedwig, TX 78152

Details & Description
Property Highlights
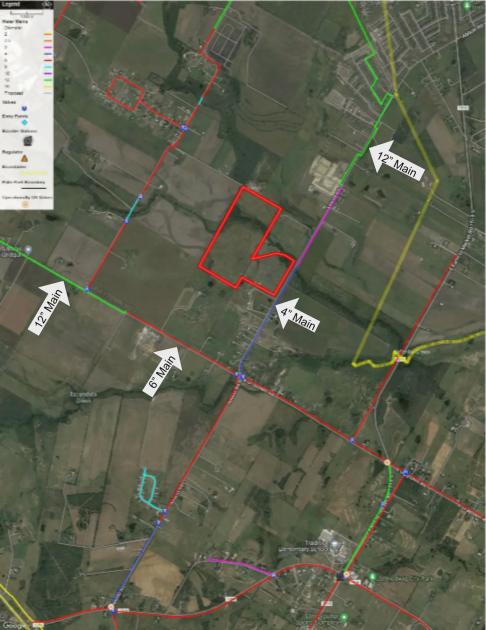
• East Central Special Utility District has a 12" line on Abbott Road - 2,700' +/- from the site
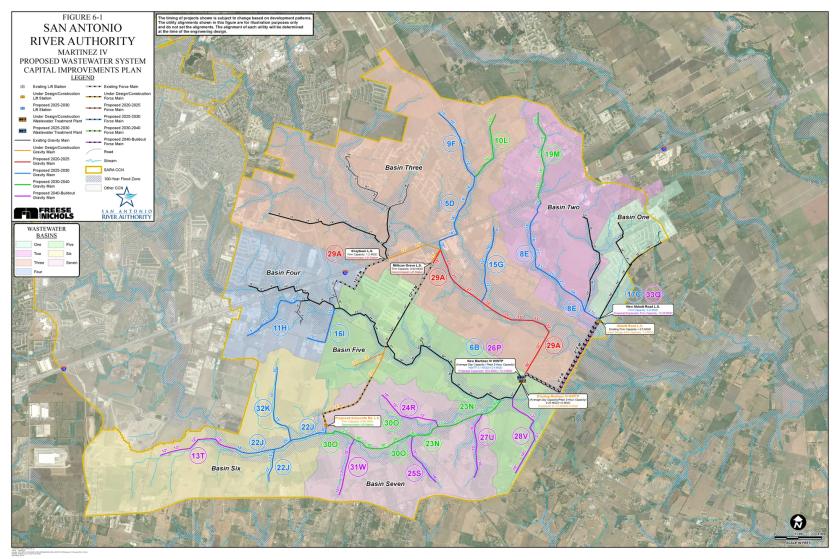
• The San Antonio River Authority is extending sewer to the southwest corner of the site
Additional Photos


Listing Agents

Jack McCaleb
O: 210-826-0036
M: 210-365-3467
jack@rfmcommercial.com
O: 210-826-0036
M: 210-365-3467
jack@rfmcommercial.com

Richard McCaleb
O: 210-826-0036
M: 210-710-3969
richard@rfmcommercial.com
O: 210-826-0036
M: 210-710-3969
richard@rfmcommercial.com
While we strive to provide the most accurate information, all listing information, and demographic data, is provided by third-parties. As such, MyEListing will not be responsible for the accuracy of the information. It is strongly recommended that you verify all information with the listing agent, and any relevant agencies, prior to making any decisions.


