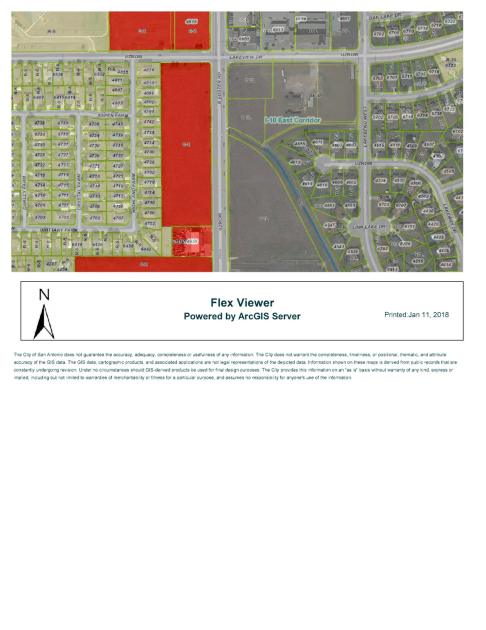
Commercial Land
Foster Road and Lakeview San Antonio, TX 78244
Foster Road and Lakeview San Antonio, TX 78244
Details & Description
Property Highlights
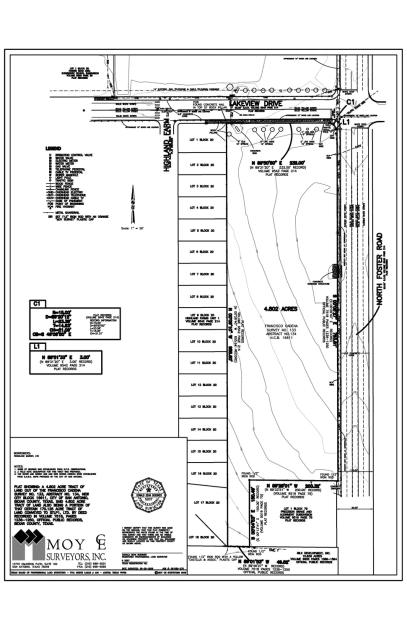
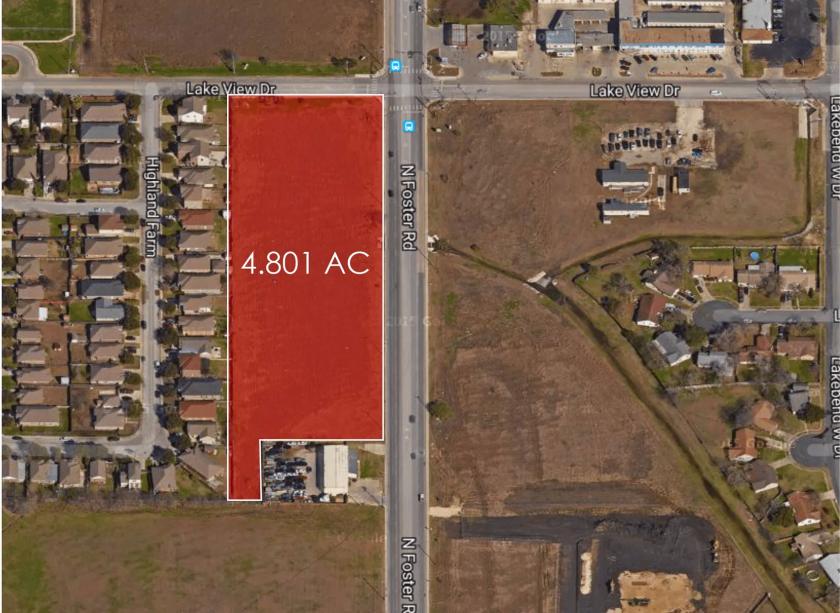
- • 800' of Frontage on Foster Road
- • 240' of Frontage on Lakeview Drive
- • CPS gas line along N. Foster Road
- • Zoning - C2 with small portion R5
Listing Agents

Richard McCaleb
O: 210-826-0036
M: 210-710-3969
richard@rfmcommercial.com
O: 210-826-0036
M: 210-710-3969
richard@rfmcommercial.com
While we strive to provide the most accurate information, all listing information, and demographic data, is provided by third-parties. As such, MyEListing will not be responsible for the accuracy of the information. It is strongly recommended that you verify all information with the listing agent, and any relevant agencies, prior to making any decisions.