Commercial Land
300 Roland Road San Antonio, TX 78220
300 Roland Road San Antonio, TX 78220
Details & Description
Property Highlights
- • Strong 3 mile radius population
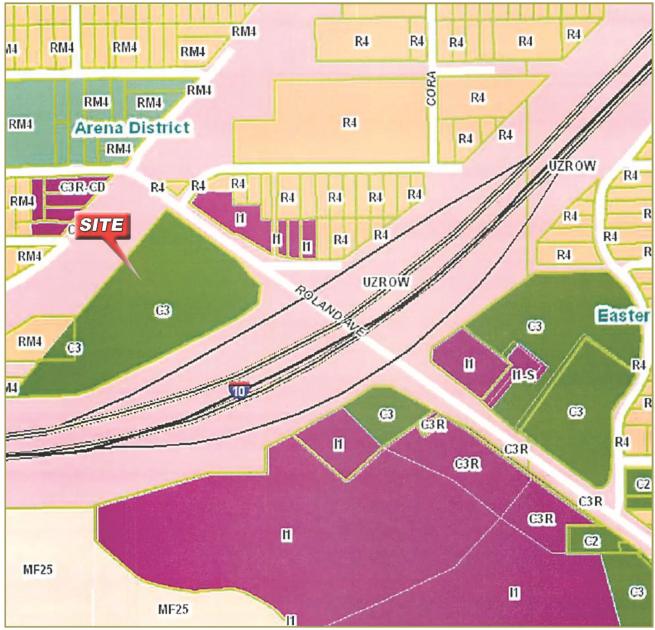
- • Centrally located
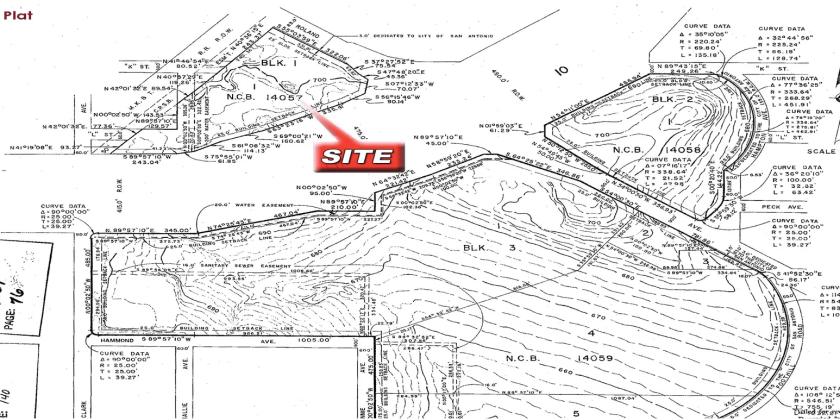
- • Platted - volume 5940-212
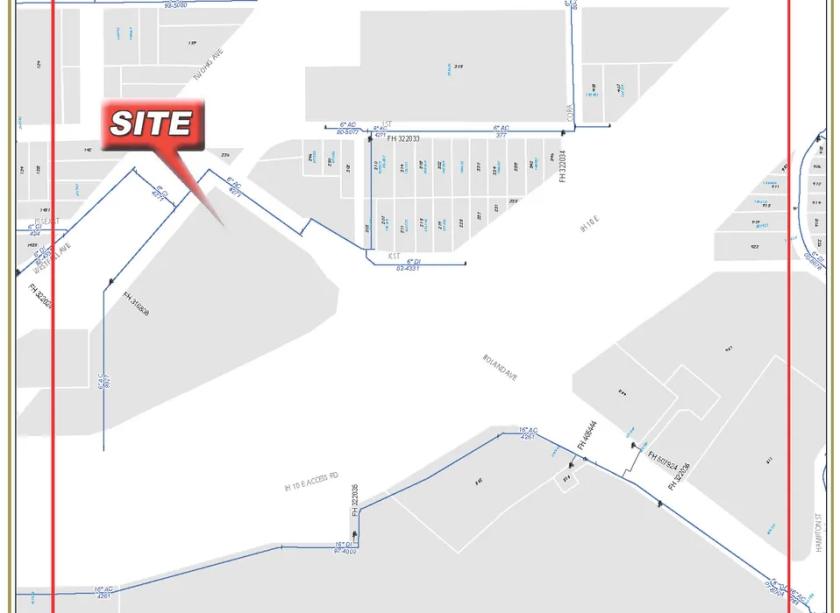
- • Highly visible from IH - 10
- • Easily accessible fo I-10 - exit ramps in place
- • Utilities
Additional Photos

Listing Agents

Richard McCaleb
O: 210-826-0036
M: 210-710-3969
richard@rfmcommercial.com
O: 210-826-0036
M: 210-710-3969
richard@rfmcommercial.com
While we strive to provide the most accurate information, all listing information, and demographic data, is provided by third-parties. As such, MyEListing will not be responsible for the accuracy of the information. It is strongly recommended that you verify all information with the listing agent, and any relevant agencies, prior to making any decisions.


