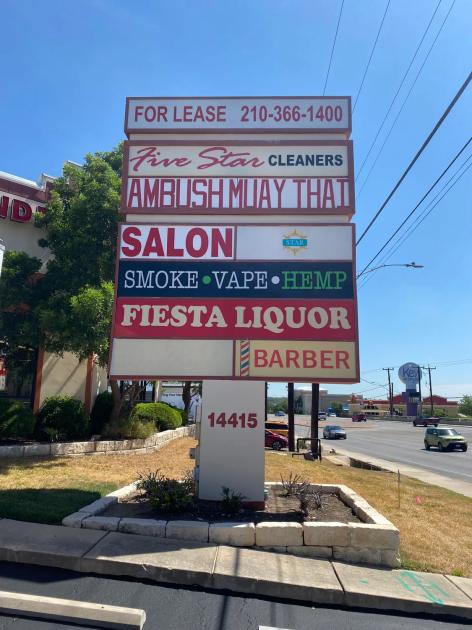
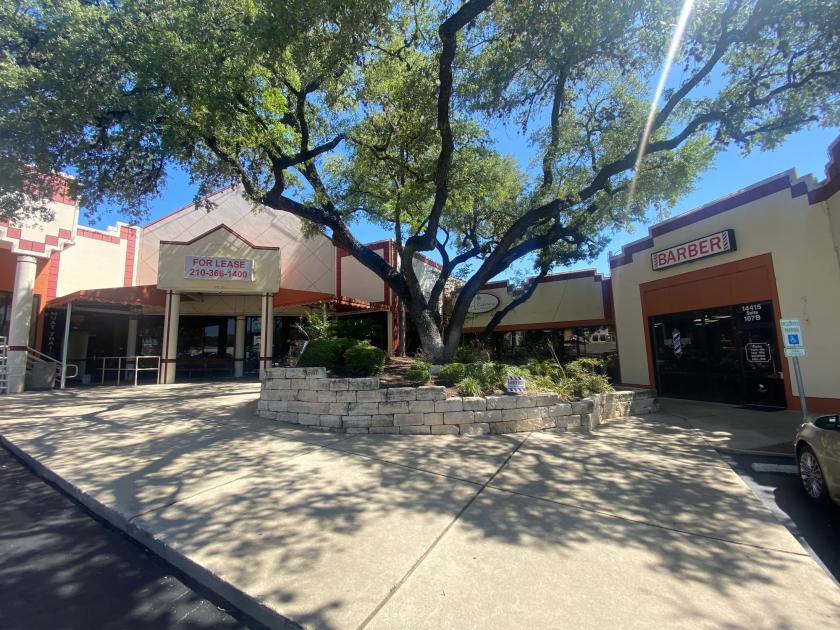
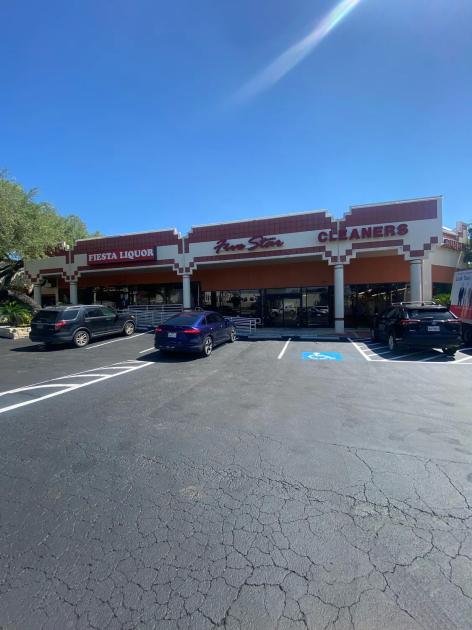
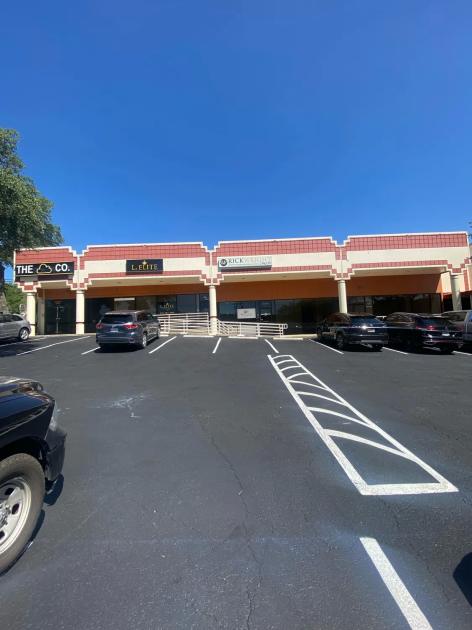
1-Mile | 3-Miles | 5-Miles | ||
---|---|---|---|---|
Total Population | 13,440 | 94,058 | 256,892 | |
Population Median Age | 38 | 39 | 38 | |
Population by Age | 0-9 Yrs | 1497 (11%) | 11078 (11%) | 31800 (12%) |
10-19 Yrs | 1884 (14%) | 11456 (12%) | 30268 (11%) | |
20-29 Yrs | 2006 (14%) | 13453 (14%) | 43203 (16%) | |
30-39 Yrs | 1770 (13%) | 13626 (14%) | 38947 (15%) | |
40-49 Yrs | 2218 (16%) | 12780 (13%) | 32339 (12%) | |
50-59 Yrs | 1593 (11%) | 11478 (12%) | 30632 (11%) | |
60-69 Yrs | 1184 (8%) | 9834 (10%) | 24692 (9%) | |
70+ Yrs | 1289 (9%) | 10353 (11%) | 25012 (9%) | |
Median HH Income | $81,983 | $73,130 | $64,604 | |
Total Household Income | < 24K | 555 (9%) | 5022 (13%) | 16676 (16%) |
25-49K | 1299 (23%) | 8416 (21%) | 22417 (22%) | |
50-74K | 718 (12%) | 6123 (15%) | 17620 (17%) | |
75-99K | 828 (14%) | 4950 (12%) | 12974 (12%) | |
100-199K | 1726 (30%) | 9077 (23%) | 22676 (22%) | |
200K+ | 480 (8%) | 4758 (12%) | 8573 (8%) | |
Highest Education Level | No Diploma | 443 | 3629 | 12918 |
Diploma or GED | 1165 | 8765 | 29479 | |
Some College | 2033 | 14483 | 40764 | |
Assoc. Degree | 665 | 5354 | 14614 | |
Bachelors Degree | 2904 | 19082 | 47661 | |
Higher Degree | 2094 | 14313 | 30239 | |
Total Housing Units | 6,097 | 41,406 | 109,164 | |
--Owner-Occupied | 2,799 | 20,154 | 49,135 | |
--Renter-Occupied | 2,807 | 18,192 | 51,800 | |
Owner-Occupied Values | < 100K | 88 | 812 | 2712 |
100-199K | 247 | 2274 | 10442 | |
200-299K | 1165 | 5989 | 16632 | |
300-399K | 913 | 5943 | 10953 | |
400-499K | 220 | 2227 | 3727 | |
500K+ | 165 | 2909 | 4670 | |
Total Working Age Population | 10,651 | 76,096 | 206,893 | |
In Work Force | 7,960 | 52,183 | 140,999 | |
Not In Work Force | 2,691 | 23,913 | 65,894 | |
Workforce Employed | 7,614 | 49,821 | 134,462 | |
Workforce Unemployed | 225 | 1,959 | 5,617 | |
Civlian Workforce | 7,839 | 51,780 | 140,079 | |
Military Workforce | 121 | 404 | 920 | |
Total Households | 5,605 | 38,346 | 100,935 | |
Family Households | 3,411 | 23,158 | 58,972 | |
Non-Family Households | 2,194 | 15,189 | 41,963 | |
Married Couple | 2,558 | 17,641 | 43,145 | |
Other Family | 853 | 5,517 | 15,827 | |
Married w/Child | 999 | 6,793 | 16,975 | |
Single Male w/Child | 158 | 635 | 1,479 | |
Single Female w/Child | 404 | 2,535 | 6,289 |
Population Change Last Two Decades - Plus Projection
2000 | % | 2010 | % | 2020 | % | 2030 | |
---|---|---|---|---|---|---|---|
Texas | 20,851,820 | +21 | 25,145,561 | +18 | 29,677,668 | +18 | 34,894,452 |
Bexar County | 1,392,931 | +23 | 1,714,773 | +22 | 2,093,502 | +20 | 2,502,617 |
Total Working Age Population:
Total Households:
Total Working Age Population:
Total Households:
Total Working Age Population:
Total Households: