Industrial Properties
6510 Blanco Road San Antonio, TX 78216
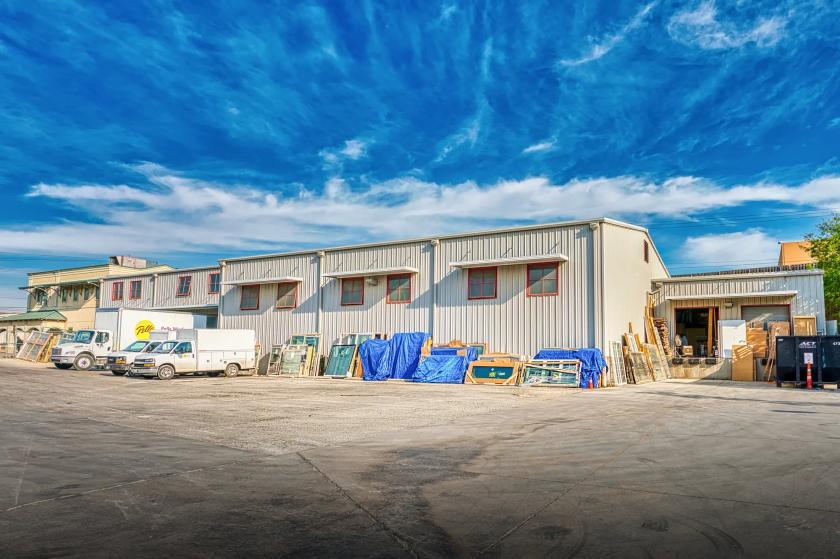
6510 Blanco Road San Antonio, TX 78216

Details & Description
Property Highlights
- • Quarter mile south of Loop 410 & Blanco Road
- • Free Standing Pylon Sign
- • 5 Dock High Doors
- • Fenced Yard
- • Twenty-two employee parking spaces
- • A premium retail location
Listing Agents

Richard McCaleb
O: 210-826-0036
M: 210-710-3969
richard@rfmcommercial.com
O: 210-826-0036
M: 210-710-3969
richard@rfmcommercial.com

Jack McCaleb
O: 210-826-0036
M: 210-365-3467
jack@rfmcommercial.com
O: 210-826-0036
M: 210-365-3467
jack@rfmcommercial.com
While we strive to provide the most accurate information, all listing information, and demographic data, is provided by third-parties. As such, MyEListing will not be responsible for the accuracy of the information. It is strongly recommended that you verify all information with the listing agent, and any relevant agencies, prior to making any decisions.