Commercial Land
SEC Sam Houston Tollway TX-8 and Spencer Highway Pasadena, TX 77505
SEC Sam Houston Tollway TX-8 and Spencer Highway Pasadena, TX 77505
Details & Description
Property Highlights
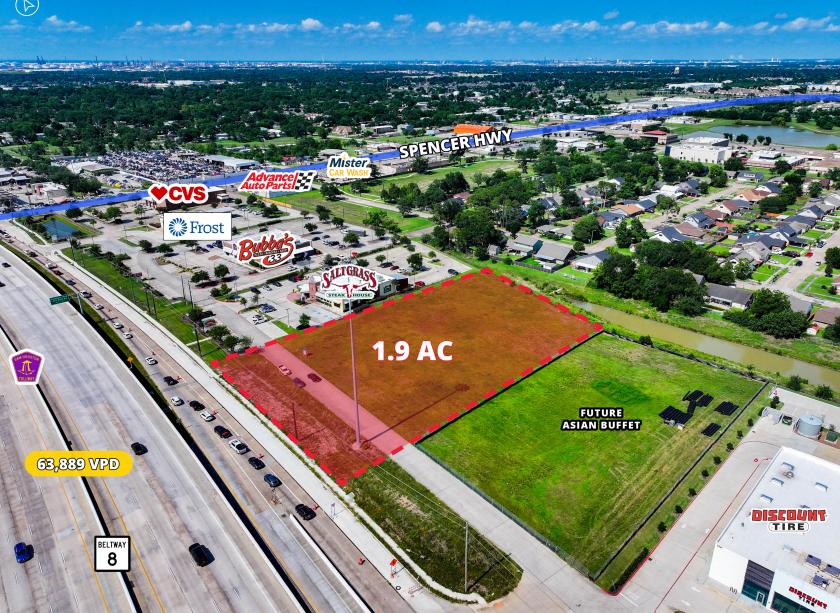
- • 1.9 acres (± 82,962 SF)
- • Adjacent to Saltgrass Steakhouse
- • Ideal for retail development
- • Frontage along East Sam Houston Parkway
- • Detention in place and all utilities provided
- • High-traffic area with large retail presence
Listing Agents

Marshall Clinkscales
O: 713-830-2157
M: 713-829-4413
marshall.clinkscales@colliers.com
O: 713-830-2157
M: 713-829-4413
marshall.clinkscales@colliers.com
While we strive to provide the most accurate information, all listing information, and demographic data, is provided by third-parties. As such, MyEListing will not be responsible for the accuracy of the information. It is strongly recommended that you verify all information with the listing agent, and any relevant agencies, prior to making any decisions.


