Retail Space
6420 Madison Road Cincinnati, OH 45227
6420 Madison Road Cincinnati, OH 45227
Details & Description
Property Highlights
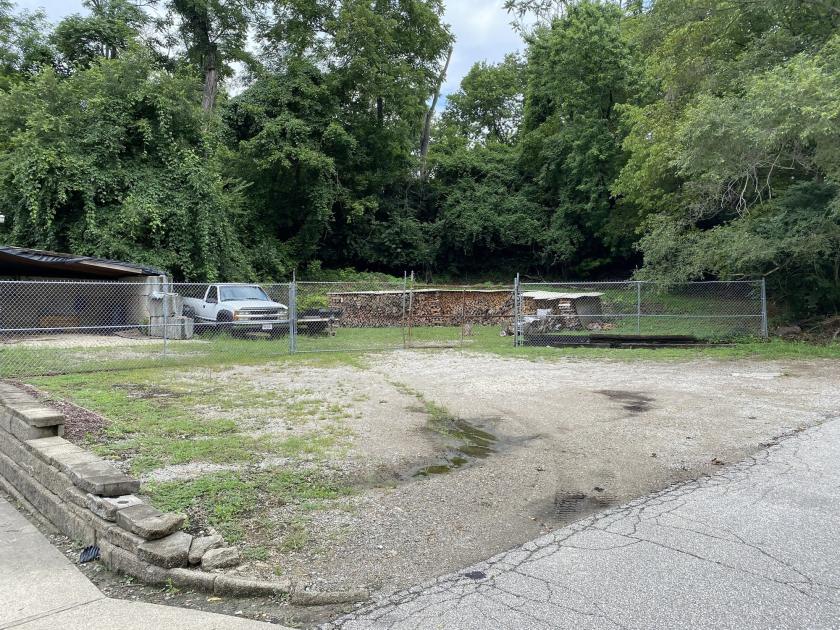
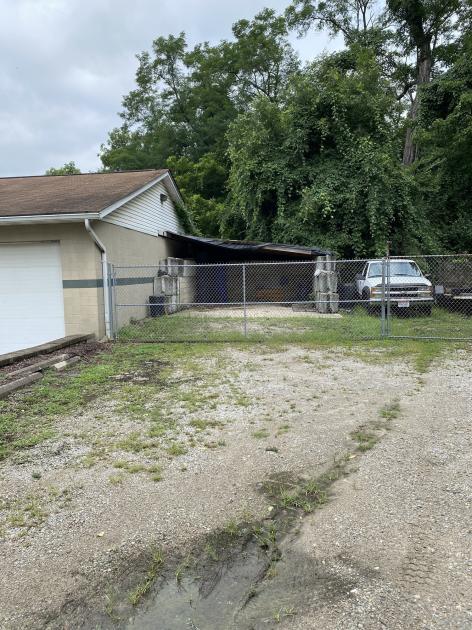
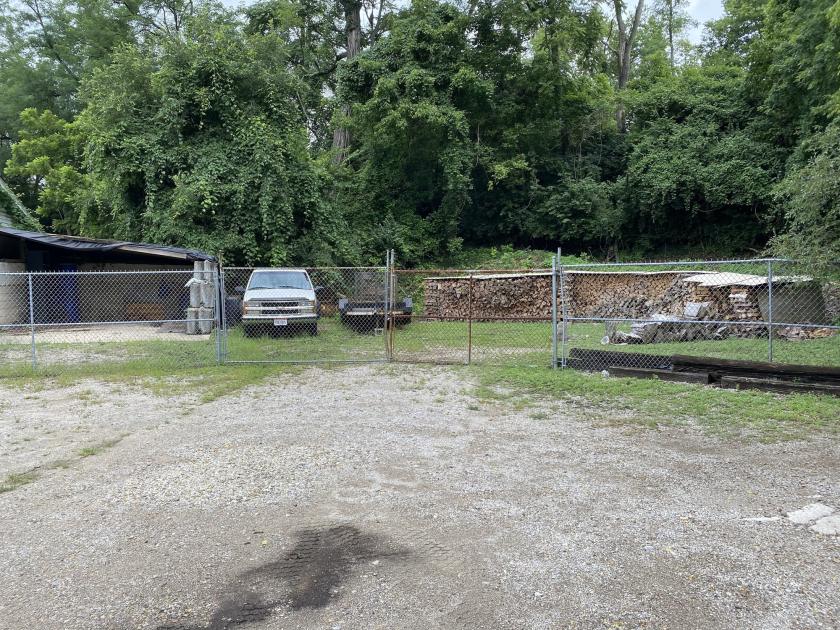
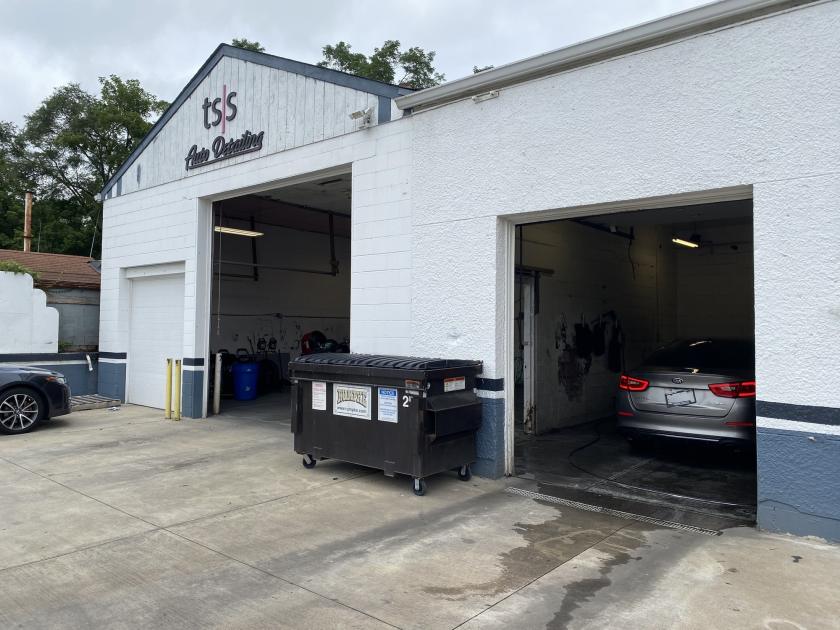
- • .362 Acre Lot In Madisonville, Oh
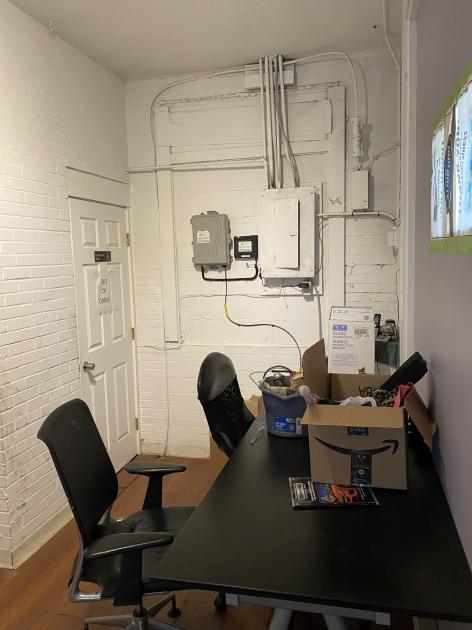
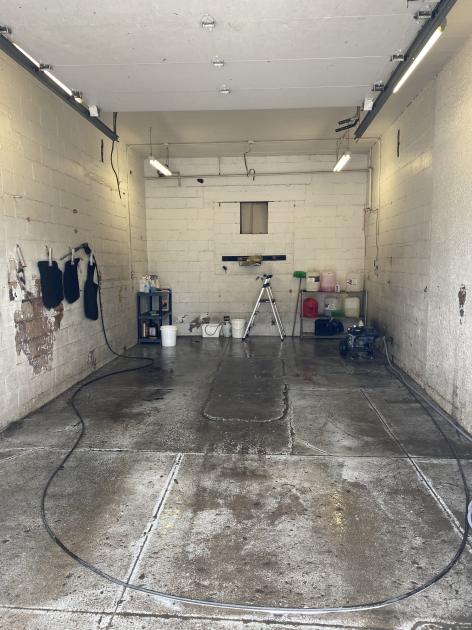
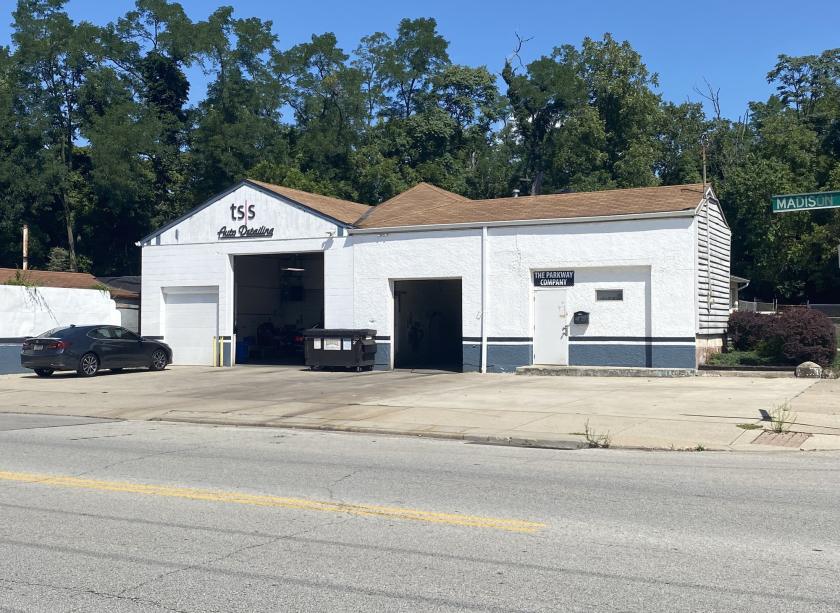
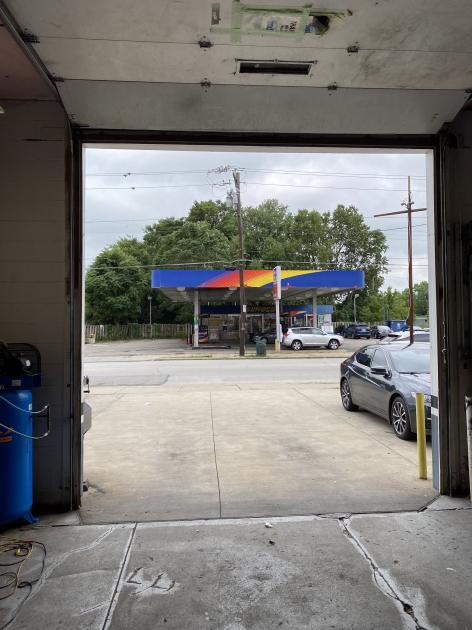
- • Auto Detailing Shop
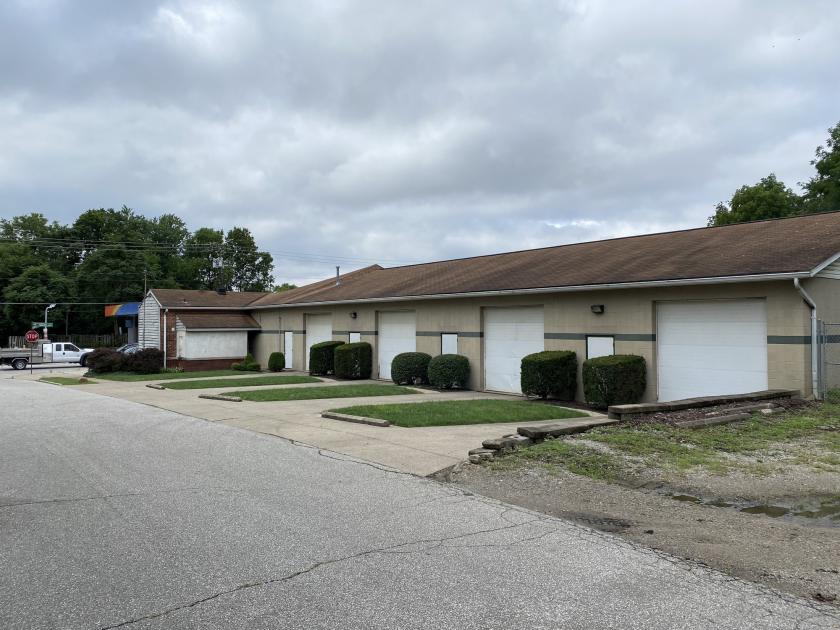
- • 6 Drive-in Doors
- • Frontage On Madison Road
- • Potential Redevelopment Opportunity
Additional Photos

Listing Agents

Laurence Bergman
O: 513-322-6307
M: 513-515-5488
larry@bergmancommercial.com
O: 513-322-6307
M: 513-515-5488
larry@bergmancommercial.com

Ryan Van Dulman
O: 513-322-8328
M: 513-377-0440
rvandulman@bergmancommercial.com
O: 513-322-8328
M: 513-377-0440
rvandulman@bergmancommercial.com
While we strive to provide the most accurate information, all listing information, and demographic data, is provided by third-parties. As such, MyEListing will not be responsible for the accuracy of the information. It is strongly recommended that you verify all information with the listing agent, and any relevant agencies, prior to making any decisions.