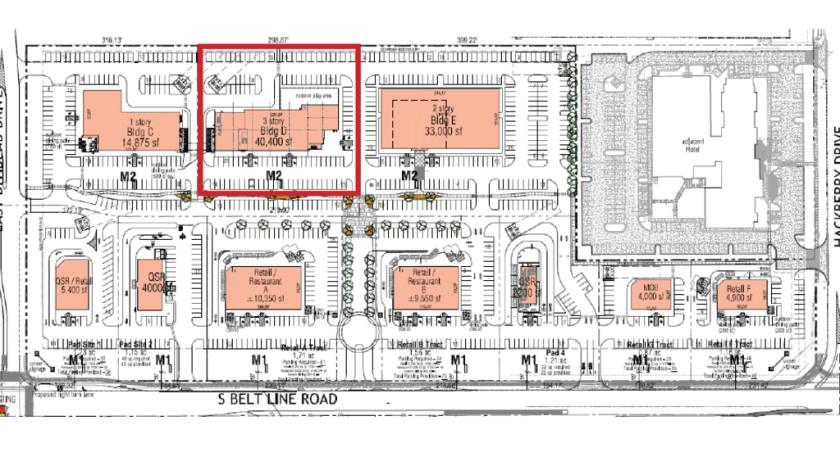
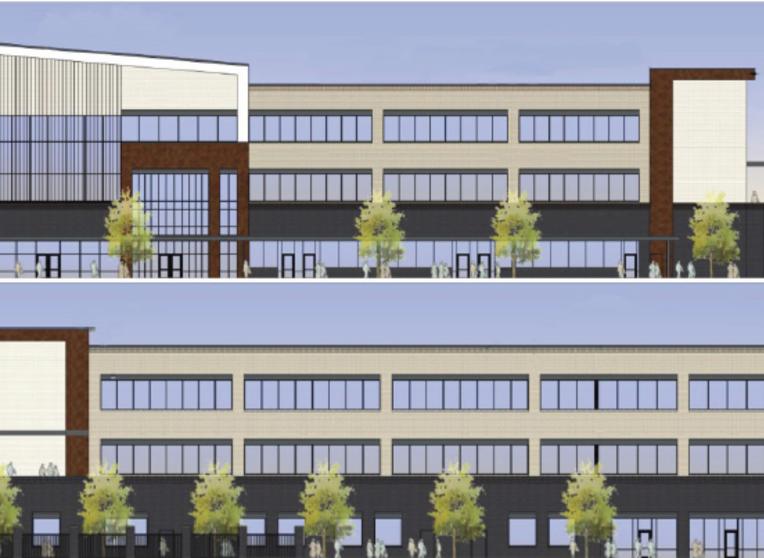
1-Mile | 3-Miles | 5-Miles | ||
---|---|---|---|---|
Total Population | 3,008 | 59,222 | 154,136 | |
Population Median Age | 34 | 34 | 34 | |
Population by Age | 0-9 Yrs | 391 (12%) | 9185 (15%) | 22925 (14%) |
10-19 Yrs | 373 (12%) | 7393 (12%) | 17493 (11%) | |
20-29 Yrs | 312 (10%) | 7413 (12%) | 24430 (15%) | |
30-39 Yrs | 904 (30%) | 11774 (19%) | 29960 (19%) | |
40-49 Yrs | 511 (16%) | 9922 (16%) | 23340 (15%) | |
50-59 Yrs | 210 (6%) | 7190 (12%) | 18969 (12%) | |
60-69 Yrs | 181 (6%) | 4072 (6%) | 10737 (6%) | |
70+ Yrs | 127 (4%) | 2273 (3%) | 6282 (4%) | |
Median HH Income | $90,138 | $103,379 | $88,815 | |
Total Household Income | < 24K | 78 (5%) | 1589 (6%) | 5392 (8%) |
25-49K | 156 (11%) | 2746 (11%) | 9522 (15%) | |
50-74K | 222 (16%) | 3166 (13%) | 11178 (17%) | |
75-99K | 389 (28%) | 3727 (16%) | 9946 (15%) | |
100-199K | 319 (23%) | 7951 (34%) | 18489 (29%) | |
200K+ | 221 (15%) | 4106 (17%) | 8650 (13%) | |
Highest Education Level | No Diploma | 46 | 1040 | 4661 |
Diploma or GED | 265 | 3435 | 13375 | |
Some College | 293 | 4893 | 16602 | |
Assoc. Degree | 51 | 2183 | 6108 | |
Bachelors Degree | 856 | 15862 | 37569 | |
Higher Degree | 649 | 12732 | 27395 | |
Total Housing Units | 1,464 | 24,821 | 68,222 | |
--Owner-Occupied | 422 | 11,002 | 22,508 | |
--Renter-Occupied | 964 | 12,284 | 40,669 | |
Owner-Occupied Values | < 100K | 23 | 293 | 910 |
100-199K | 1 | 410 | 1504 | |
200-299K | 51 | 1766 | 4021 | |
300-399K | 127 | 3312 | 5623 | |
400-499K | 127 | 2898 | 5480 | |
500K+ | 92 | 2323 | 4968 | |
Total Working Age Population | 2,402 | 44,813 | 119,991 | |
In Work Force | 1,873 | 34,071 | 92,289 | |
Not In Work Force | 530 | 10,742 | 27,703 | |
Workforce Employed | 1,810 | 32,741 | 88,948 | |
Workforce Unemployed | 52 | 1,119 | 3,122 | |
Civlian Workforce | 1,862 | 33,861 | 92,070 | |
Military Workforce | 11 | 210 | 219 | |
Total Households | 1,386 | 23,286 | 63,177 | |
Family Households | 705 | 16,141 | 39,690 | |
Non-Family Households | 681 | 7,145 | 23,487 | |
Married Couple | 595 | 13,750 | 31,622 | |
Other Family | 110 | 2,390 | 8,067 | |
Married w/Child | 275 | 7,608 | 16,351 | |
Single Male w/Child | 0 | 237 | 1,084 | |
Single Female w/Child | 77 | 1,228 | 3,545 |
Population Change Last Two Decades - Plus Projection
2000 | % | 2010 | % | 2020 | % | 2030 | |
---|---|---|---|---|---|---|---|
Texas | 20,851,820 | +21 | 25,145,561 | +18 | 29,677,668 | +18 | 34,894,452 |
Tarrant County | 1,446,219 | +25 | 1,809,034 | +19 | 2,143,755 | +17 | 2,507,170 |
Denton County | 432,976 | +53 | 662,614 | +36 | 897,953 | +37 | 1,234,110 |
Dallas County | 2,218,899 | +7 | 2,368,139 | +15 | 2,734,111 | +14 | 3,106,298 |
Total Working Age Population:
Total Households:
Total Working Age Population:
Total Households:
Total Working Age Population:
Total Households: