Retail Space
16560 FM-602 Round Rock, TX 78681
16560 FM-602 Round Rock, TX 78681

Details & Description
Property Highlights
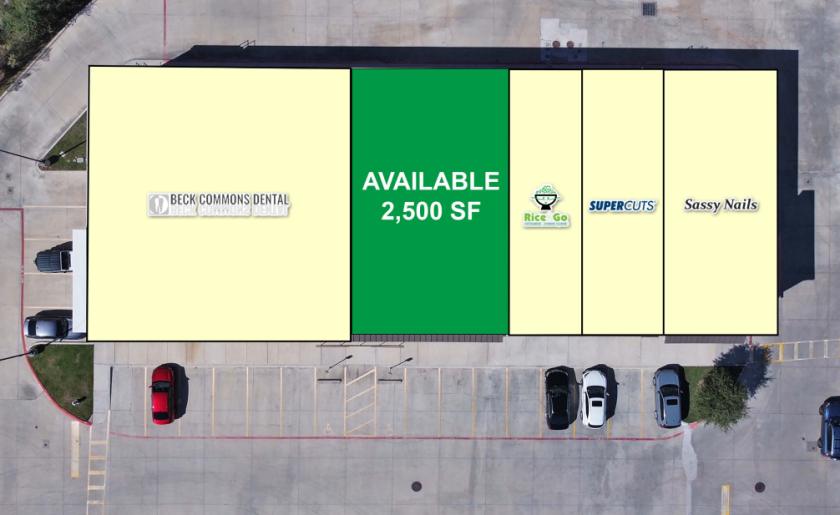
• Highly visible facade and pylon signage along FM 620, which serves over 33,000 vehicles per day
• HEB, Starbucks, Dairy Queen, Whataburger, and Chipotle are all in the immediate trade area
Listing Agents

Patrick Connolly
O: 832-771-3679
pconnolly@resolutre.com
O: 832-771-3679
pconnolly@resolutre.com

Michael Noteboom
O: 512-695-6958
mnoteboom@resolutre.com
O: 512-695-6958
mnoteboom@resolutre.com
While we strive to provide the most accurate information, all listing information, and demographic data, is provided by third-parties. As such, MyEListing will not be responsible for the accuracy of the information. It is strongly recommended that you verify all information with the listing agent, and any relevant agencies, prior to making any decisions.