Commercial Land
Hwy 281 and Marshall Rd San Antonio, TX 78258
Hwy 281 and Marshall Rd San Antonio, TX 78258
Details & Description
Property Highlights
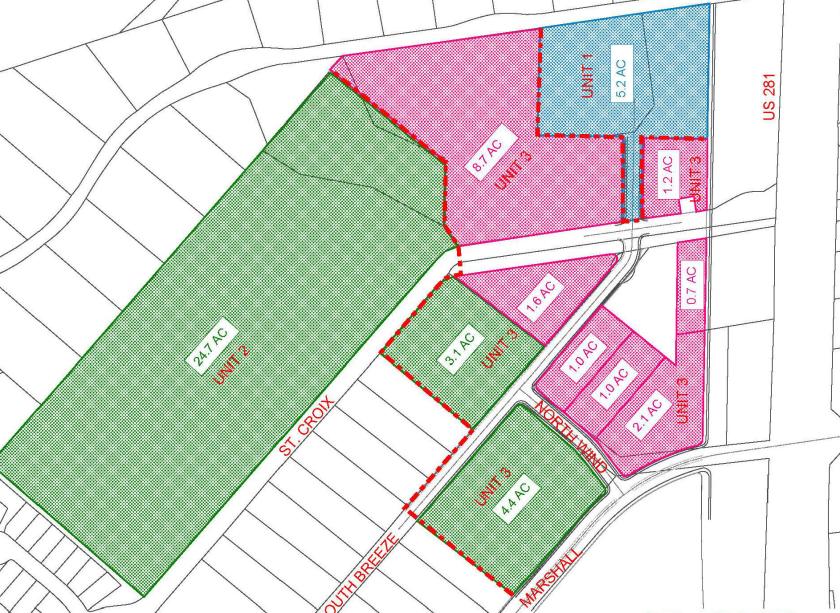
- • Corner of Marshall Rd and Highway 281 North
- • Super Street cross-over at intersection
- • Category One
- • 15.67 AC Commercial - C2 ERZD
- • 32.2 AC Residential - OCL RES ERZD
Listing Agents

Deborah Bauer
O: 210-402-6363
deborah@drakecommercial.com
O: 210-402-6363
deborah@drakecommercial.com
While we strive to provide the most accurate information, all listing information, and demographic data, is provided by third-parties. As such, MyEListing will not be responsible for the accuracy of the information. It is strongly recommended that you verify all information with the listing agent, and any relevant agencies, prior to making any decisions.


