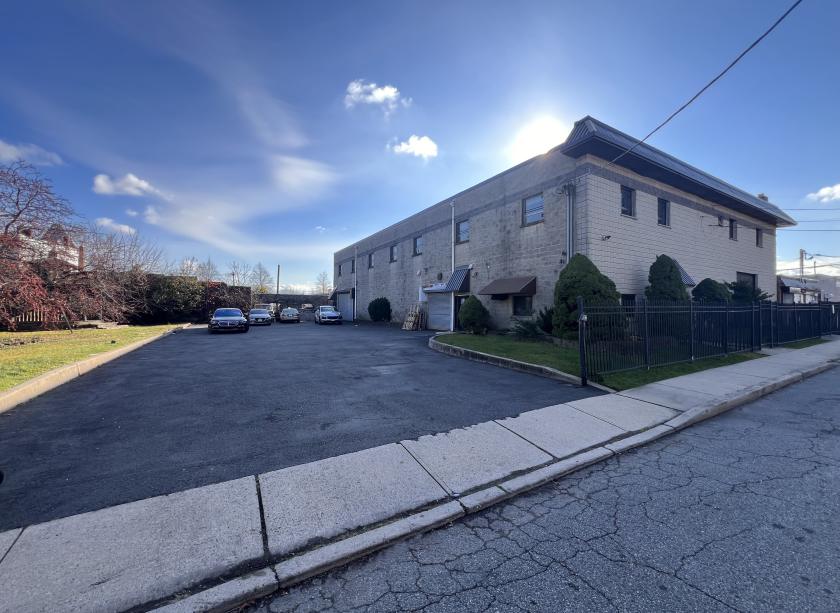
Industrial Properties
396 Littleton Avenue Newark, NJ 07103
396 Littleton Avenue Newark, NJ 07103
Details & Description
Property Highlights
- • ±10,000 SF Total Building Size
- • ±0.59-Acre Lot (Block 299, Lot 35.02)
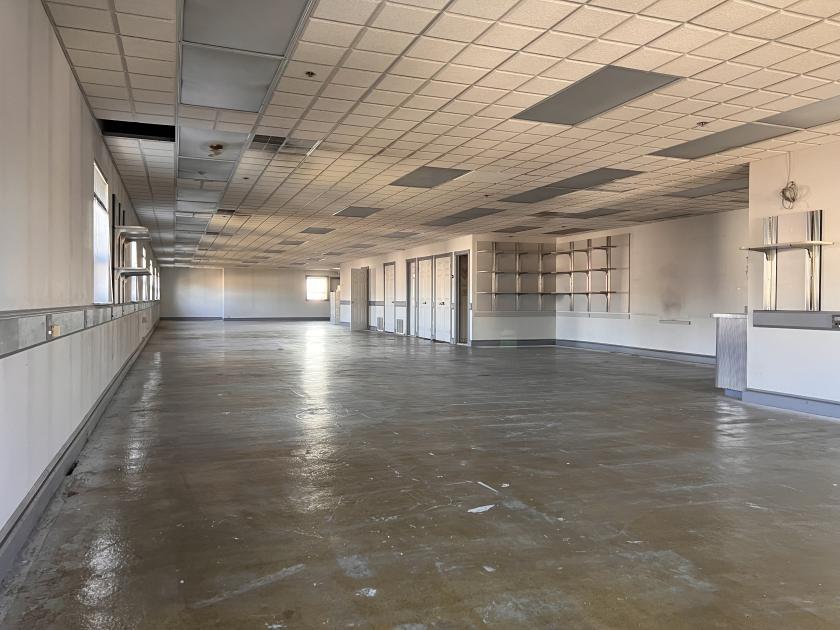
- • ±3,500 SF Available Suite A (2nd Story Office)
- • ±10,000 SF Suite B
- • Column Spacing Varies
- • ±14' - 22' Ceiling Heights
Additional Photos

Listing Agents

Dylan Meade
O: 973-379-6644
dmeade@blauberg.com
O: 973-379-6644
dmeade@blauberg.com
While we strive to provide the most accurate information, all listing information, and demographic data, is provided by third-parties. As such, MyEListing will not be responsible for the accuracy of the information. It is strongly recommended that you verify all information with the listing agent, and any relevant agencies, prior to making any decisions.


