Office Space
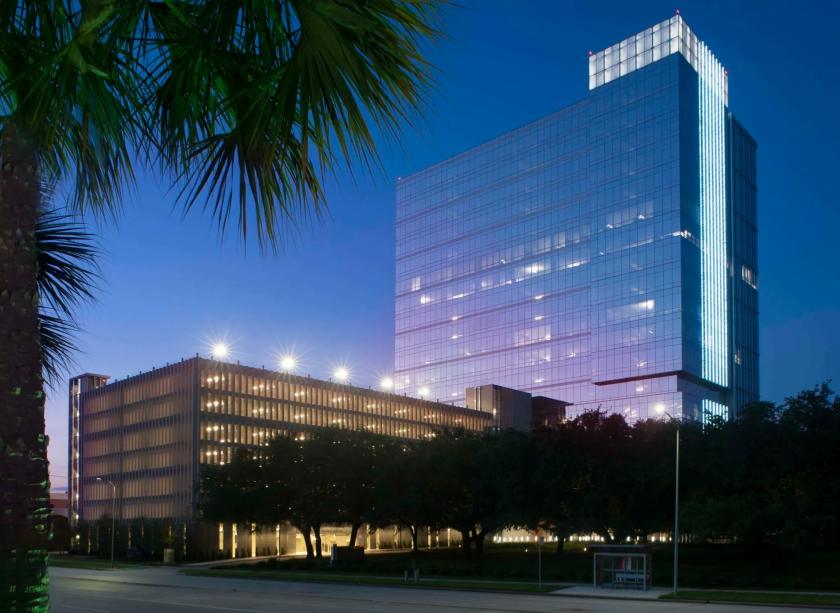
3737 Buffalo Speedway Houston, TX 77098
3737 Buffalo Speedway Houston, TX 77098
Details & Description
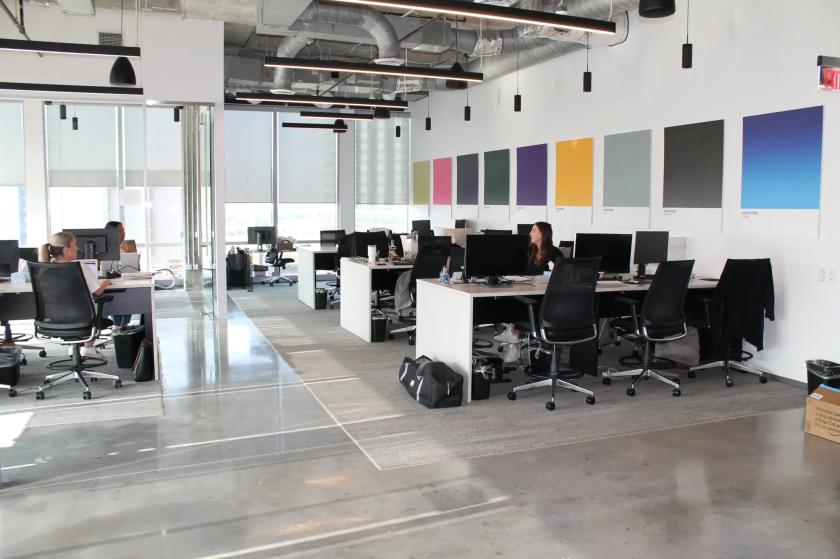
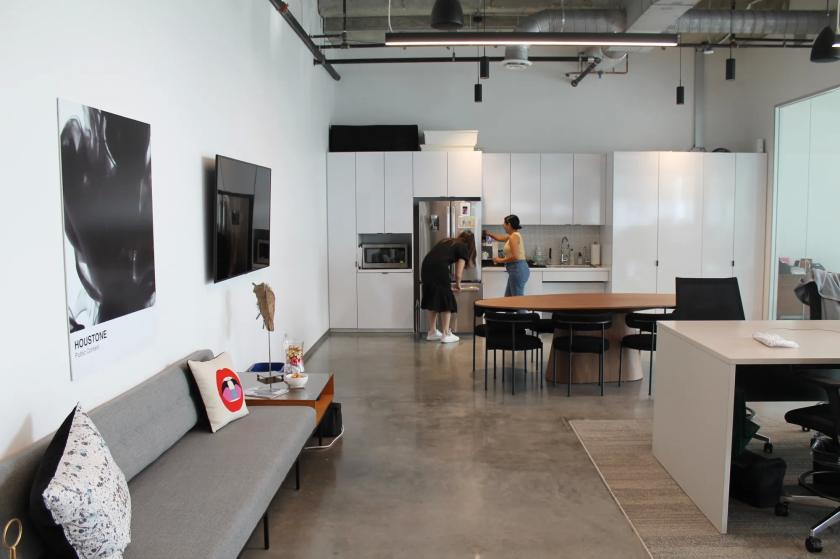
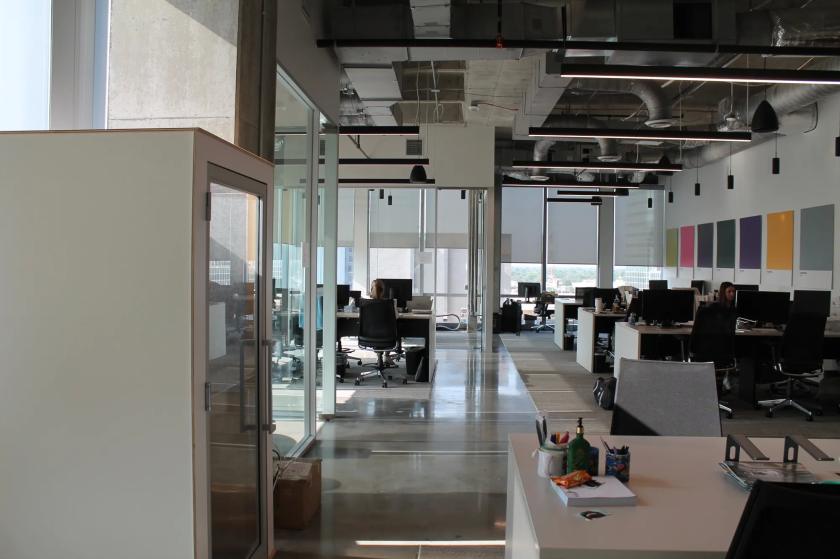
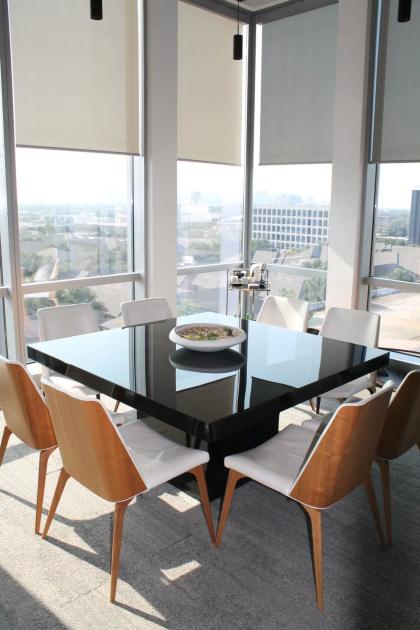
Property Highlights
- • Approximately 3,061 Square Feet
- • Term Through January 2030
- • Above Standard Finish
- • Coffee Bar
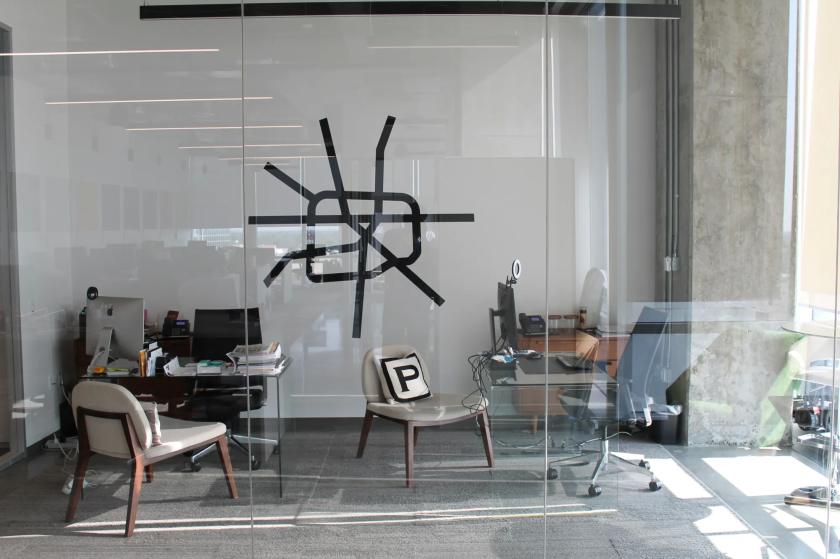
- • Extensive Interior Glass
- • Concrete Floors
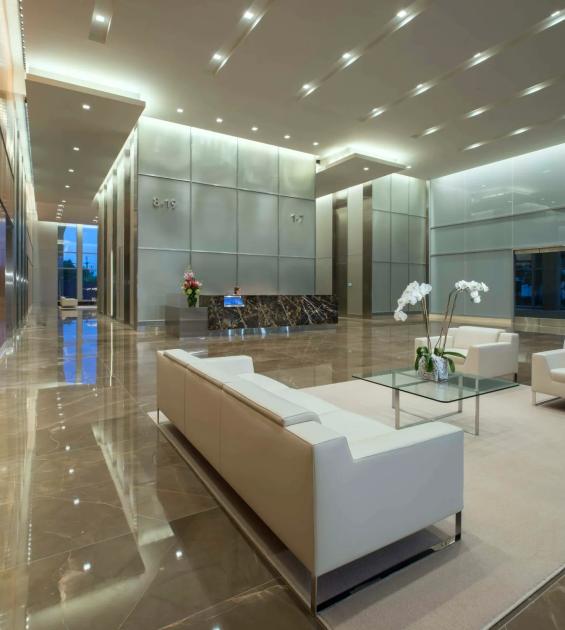
Additional Photos
Listing Agents

Adam Strauss
O: 713-332-8210
adams@belvoir.net
O: 713-332-8210
adams@belvoir.net
While we strive to provide the most accurate information, all listing information, and demographic data, is provided by third-parties. As such, MyEListing will not be responsible for the accuracy of the information. It is strongly recommended that you verify all information with the listing agent, and any relevant agencies, prior to making any decisions.