Industrial Properties
1020-7030 Avenue C Houston, TX 77011
1020-7030 Avenue C Houston, TX 77011
Details & Description
Property Highlights
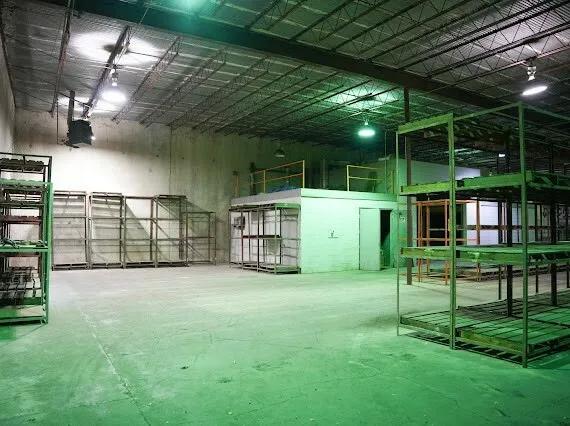
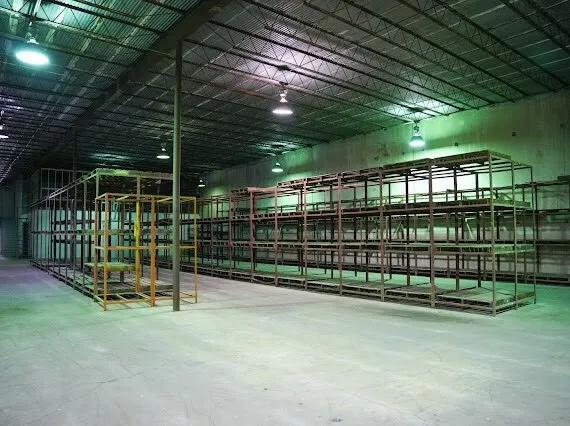
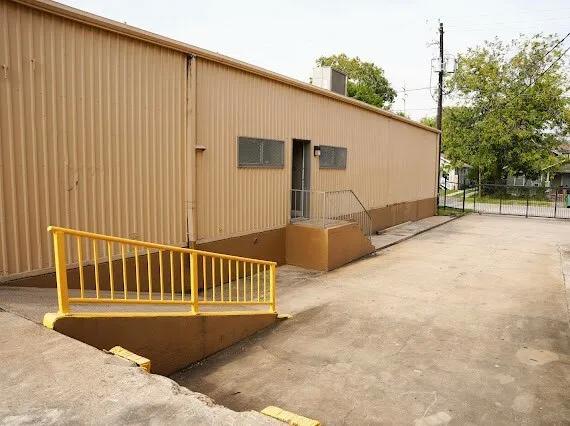
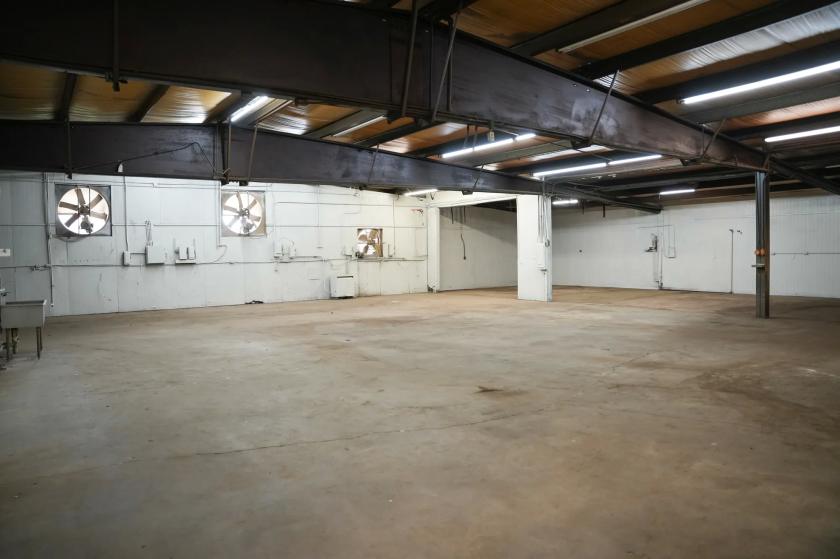
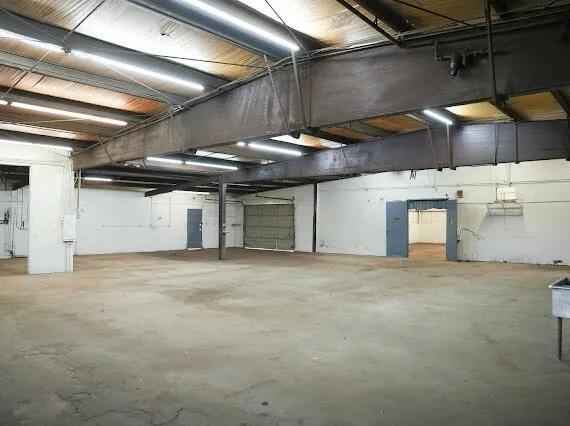
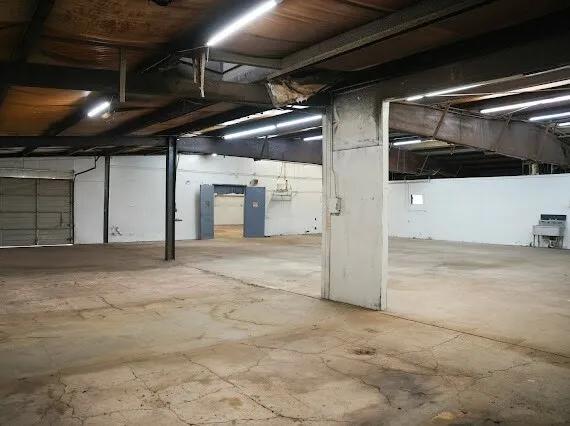
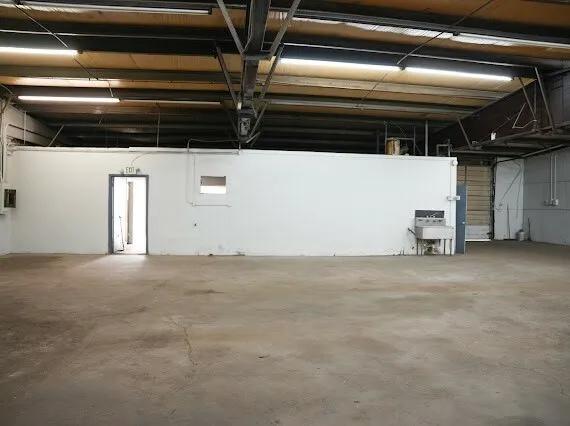
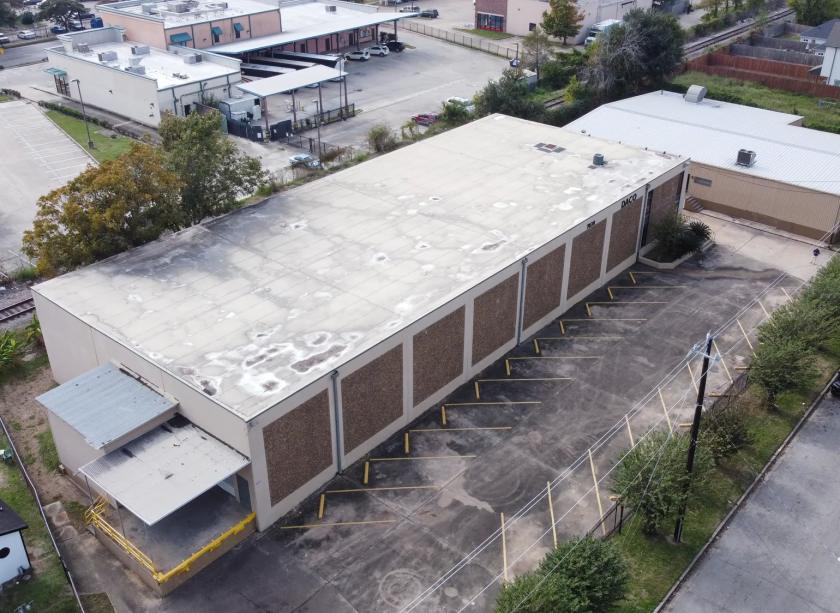
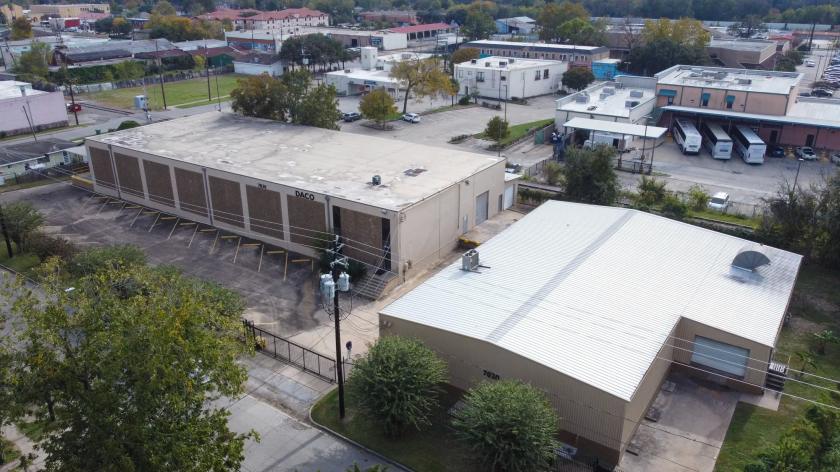
- • Building 1 (+/-15,240 SF), 2 stories
- • Building 2 (+/-7200 SF), 1 story
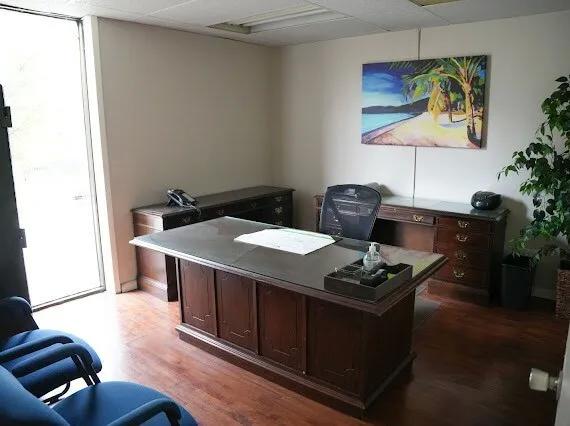
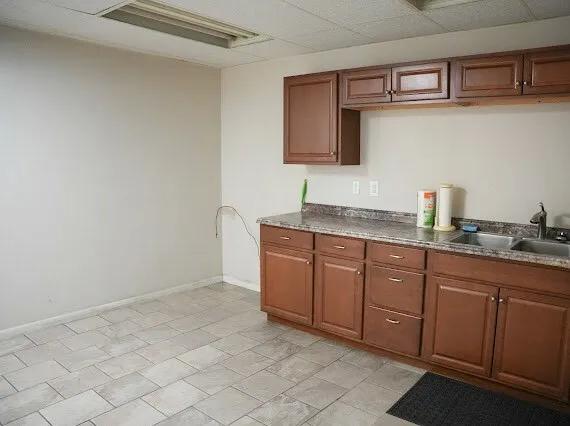
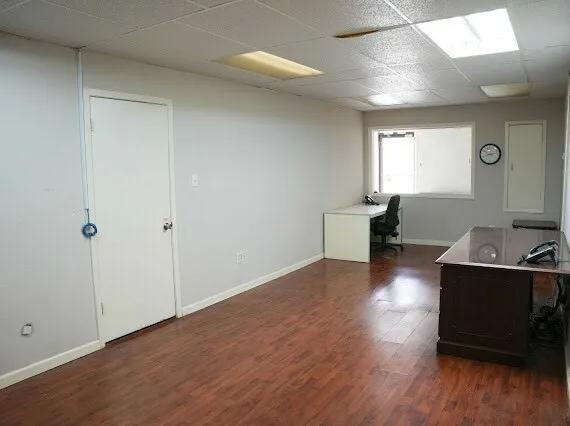
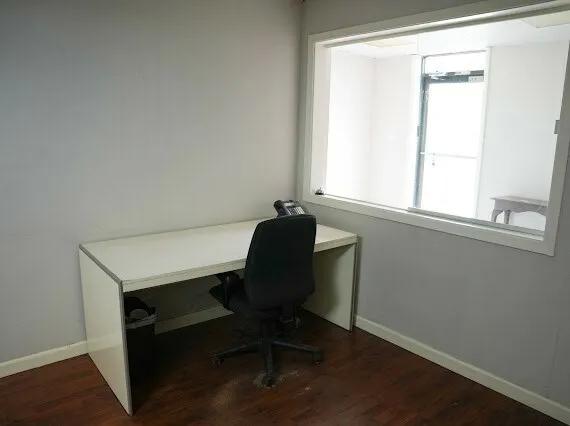
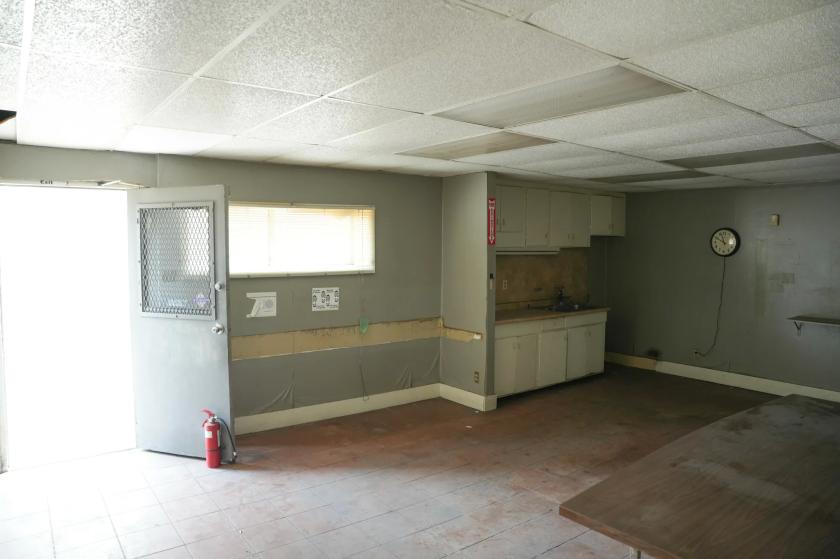
- • Office space, kitchens, restrooms
- • No flood zone, never flooded per seller
- • Both roofs appx. 7 yrs old
- • Fenced property
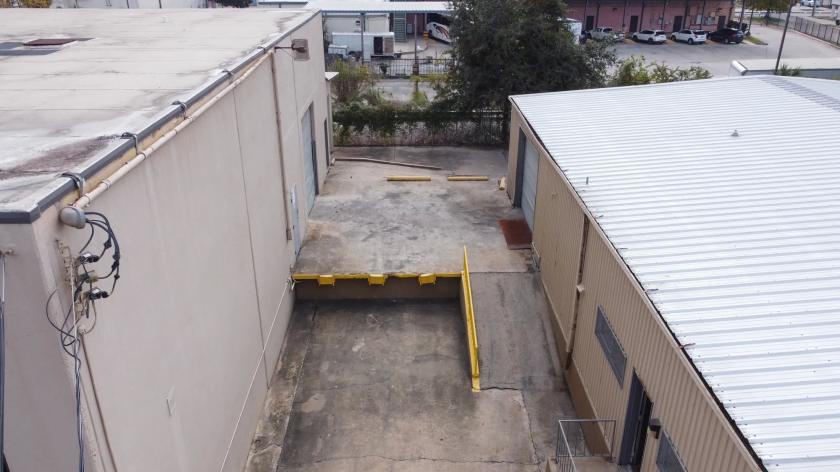
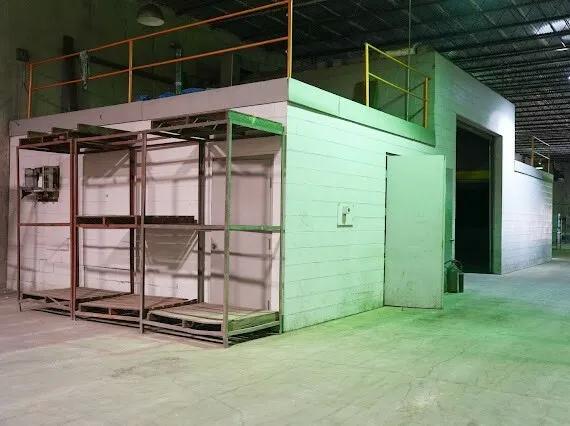
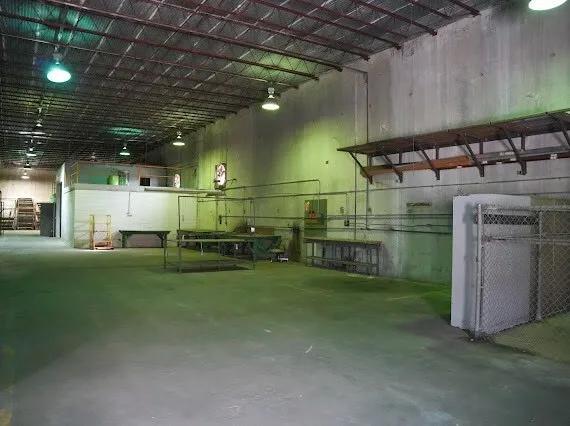
Additional Photos
Listing Agents

Viv Kay Nguyen
O: 713-332-8213
vivn@belvoir.net
O: 713-332-8213
vivn@belvoir.net
While we strive to provide the most accurate information, all listing information, and demographic data, is provided by third-parties. As such, MyEListing will not be responsible for the accuracy of the information. It is strongly recommended that you verify all information with the listing agent, and any relevant agencies, prior to making any decisions.