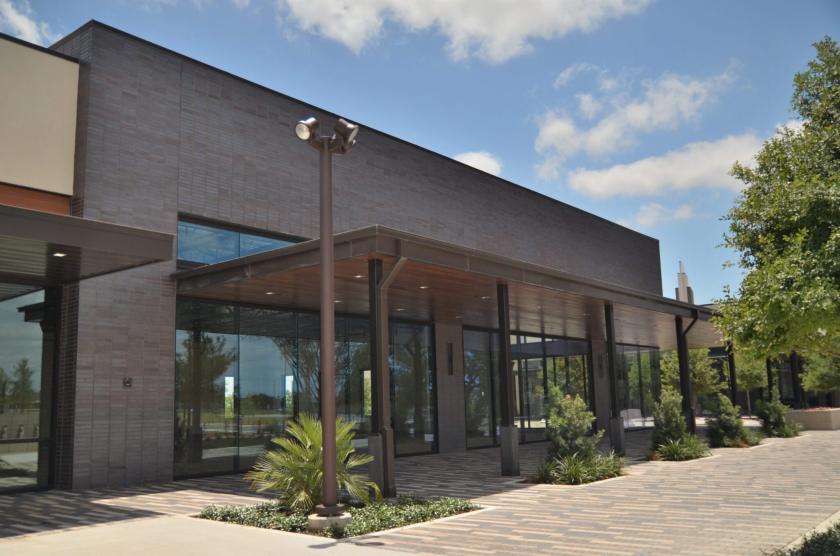
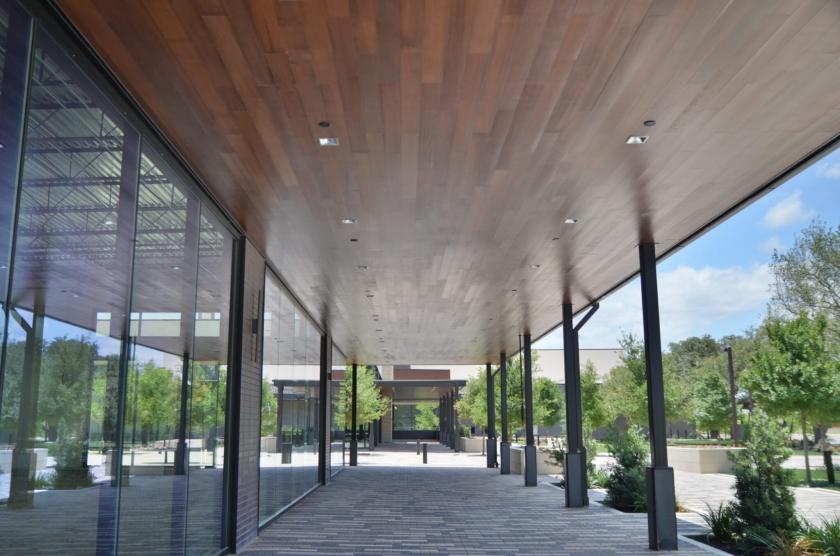
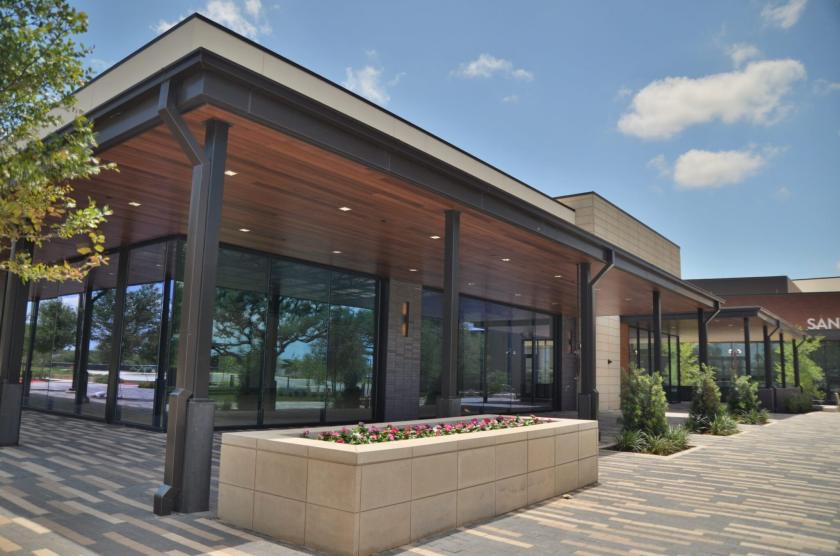
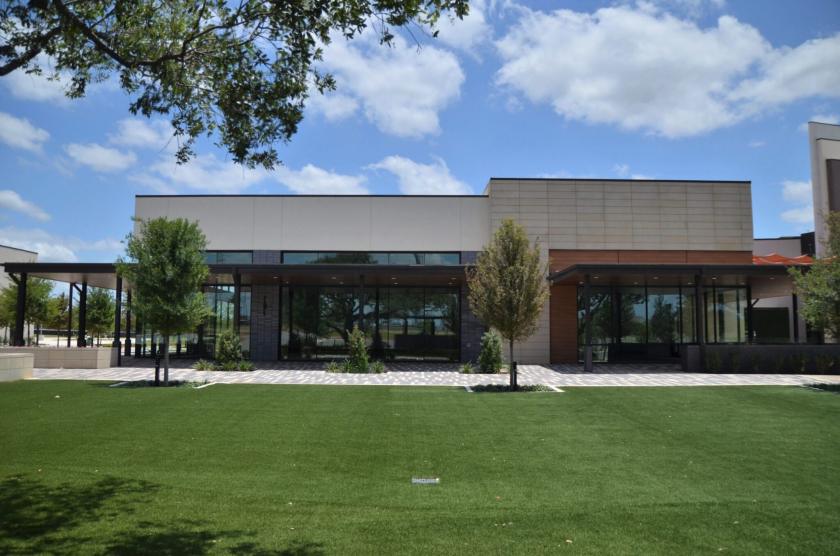
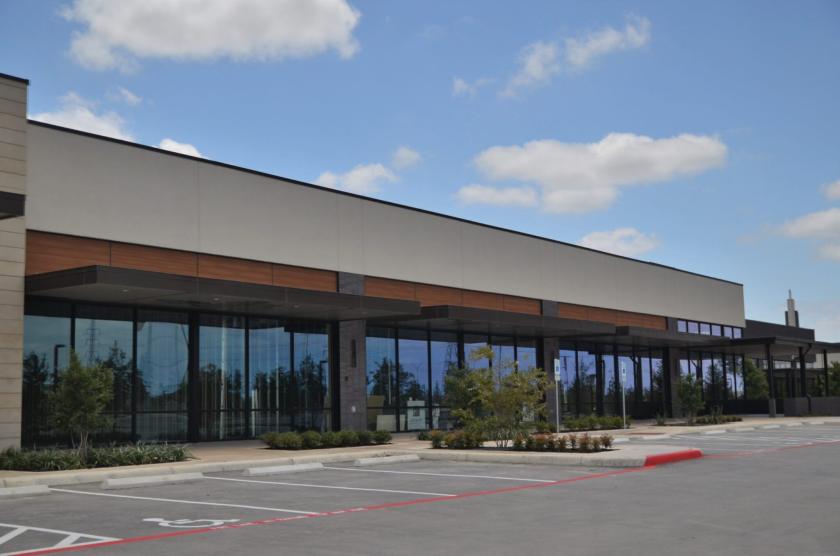
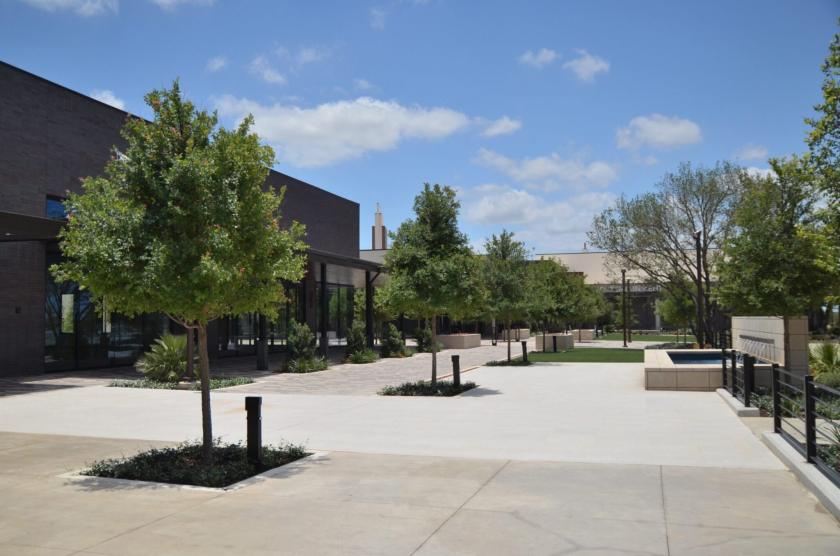
Retail Space
18124 I-35 Cibolo, TX 78108
18124 I-35 Cibolo, TX 78108
Details & Description
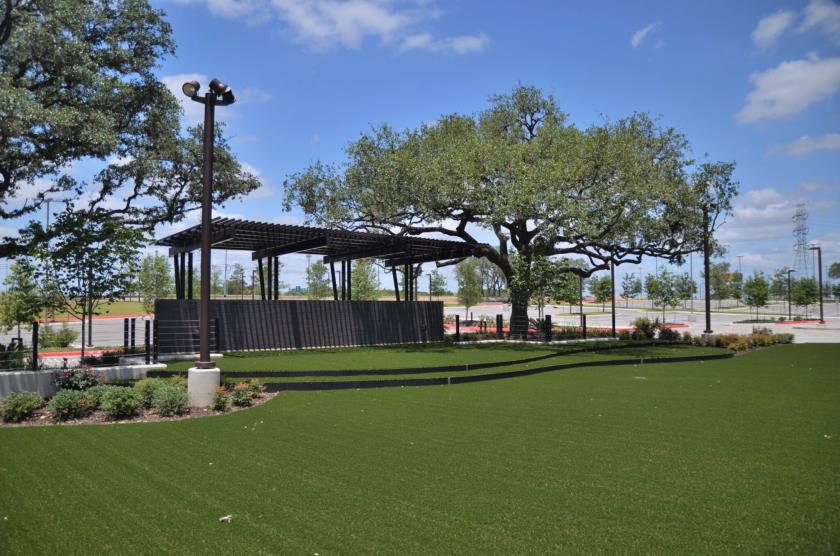
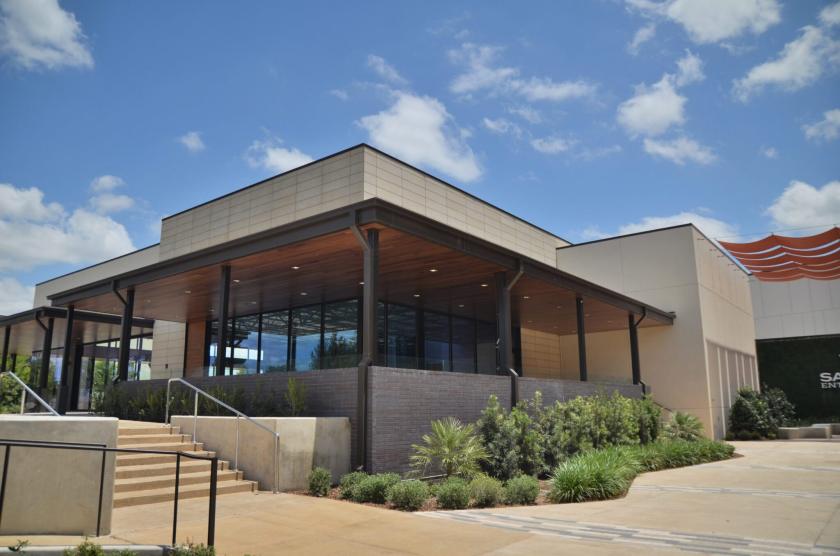
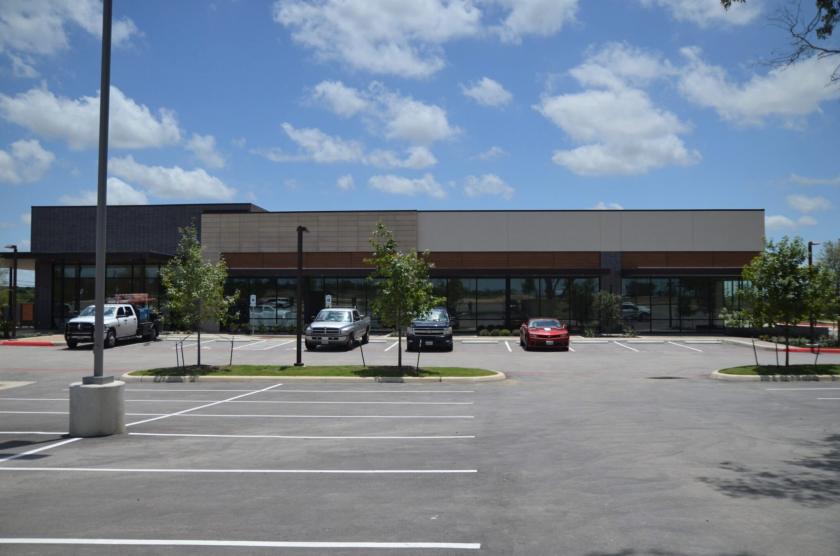
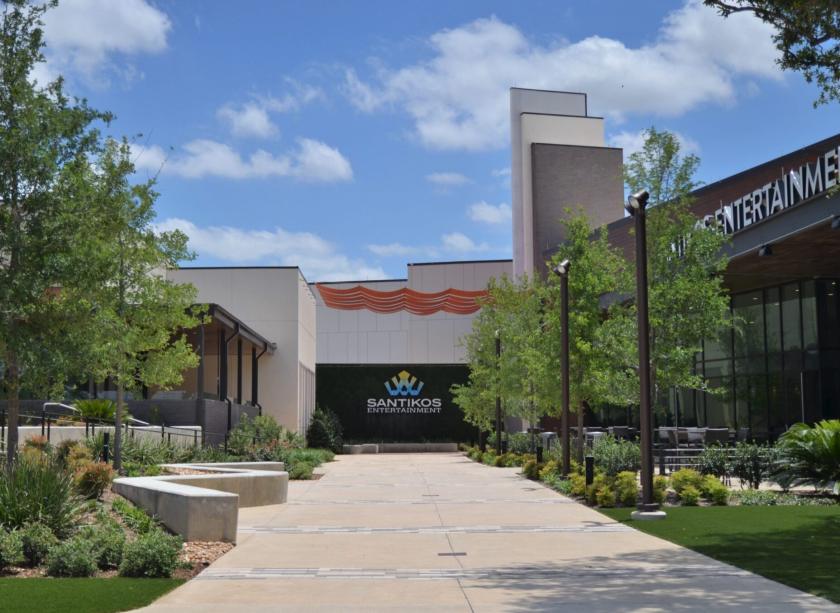
Additional Photos


Listing Agents

Jonathan Collins
O: 210-824-4242
M: 210-269-1886
jonathan@valcorcre.com
O: 210-824-4242
M: 210-269-1886
jonathan@valcorcre.com

Chris Ewald
O: 210-824-4242
M: 210-365-7275
chris@valcorcre.com
O: 210-824-4242
M: 210-365-7275
chris@valcorcre.com

Adam Schiller
O: 210-742-6681
M: 210-232-4409
adam@valcorcre.com
O: 210-742-6681
M: 210-232-4409
adam@valcorcre.com
While we strive to provide the most accurate information, all listing information, and demographic data, is provided by third-parties. As such, MyEListing will not be responsible for the accuracy of the information. It is strongly recommended that you verify all information with the listing agent, and any relevant agencies, prior to making any decisions.