Industrial Properties
8139 Tidwell Road Houston, TX 77028
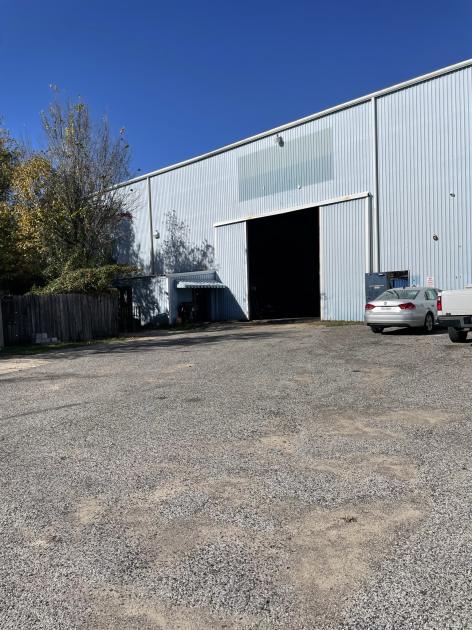
8139 Tidwell Road Houston, TX 77028

Details & Description
Property Highlights
- • Total size: ±13,300 SF
- • ±12,050 SF metal warehouse
- • ±1.6116 AC mostly stabilized
- • 10-Ton overhead crane
- • Hook height: 24’
- • Eave height: 30’
Additional Photos


Listing Agents

Chris Klein
O: 713-830-2141
M: 281-772-4433
chris.klein@colliers.com
O: 713-830-2141
M: 281-772-4433
chris.klein@colliers.com
While we strive to provide the most accurate information, all listing information, and demographic data, is provided by third-parties. As such, MyEListing will not be responsible for the accuracy of the information. It is strongly recommended that you verify all information with the listing agent, and any relevant agencies, prior to making any decisions.


