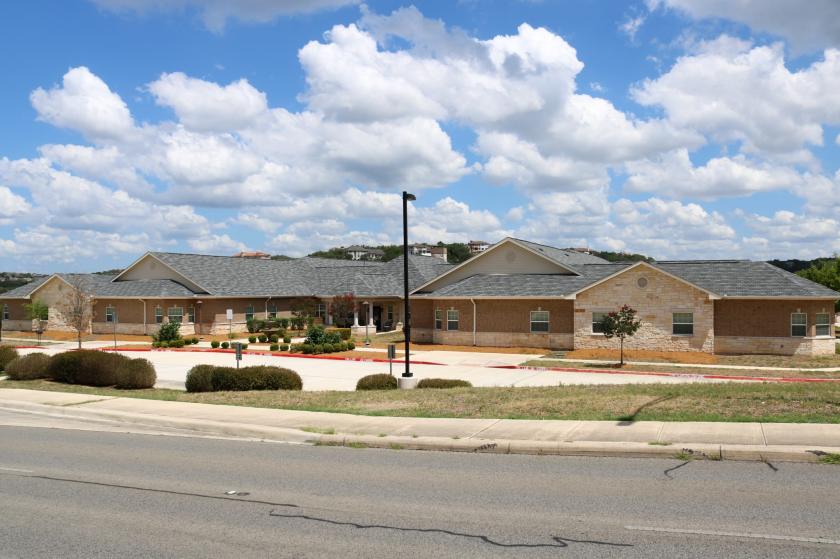
Health Care and Medical Properties
20271 Stone Oak Parkway San Antonio, TX 78258
20271 Stone Oak Parkway San Antonio, TX 78258
Details & Description
Property Highlights
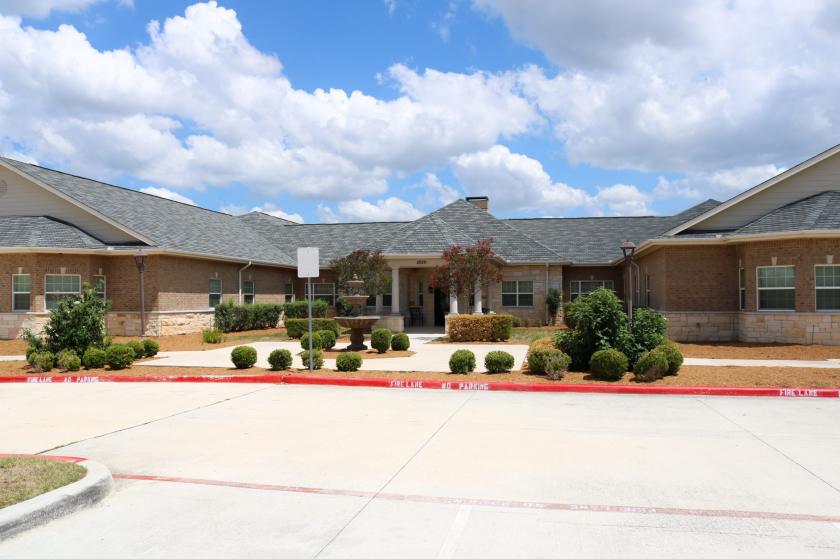
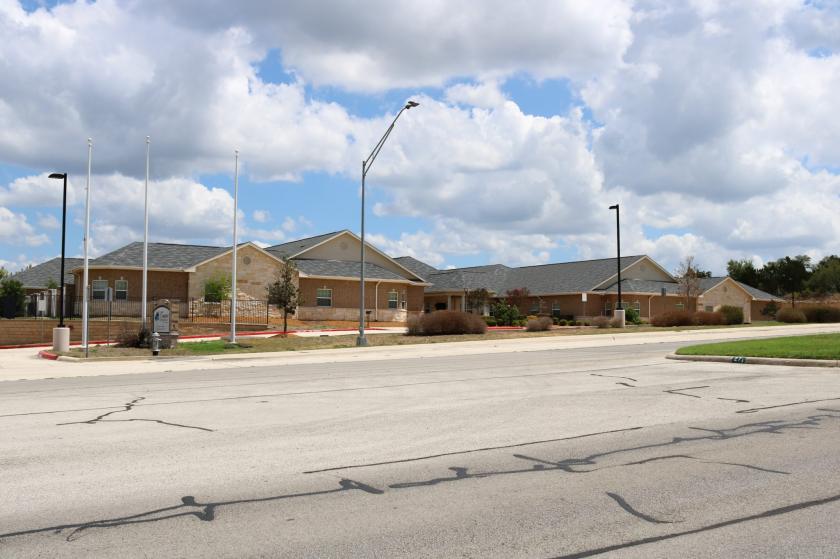
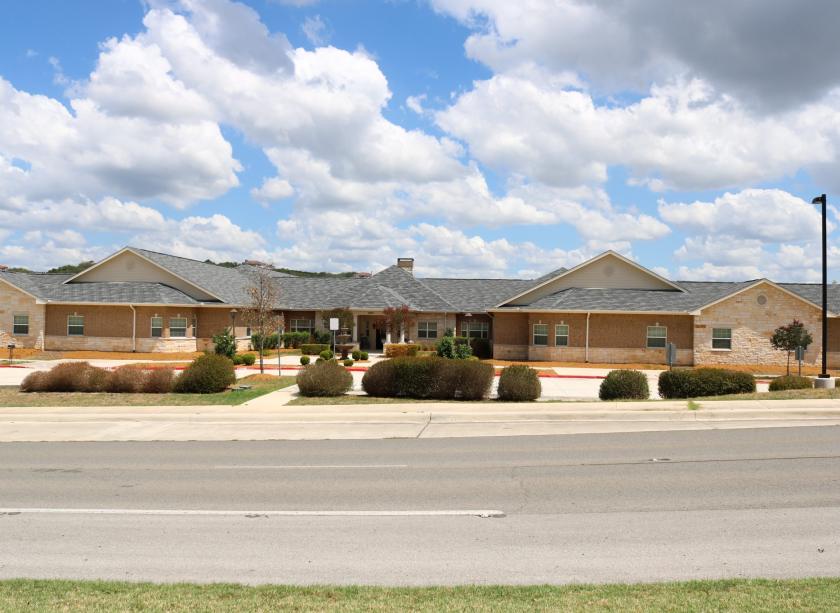
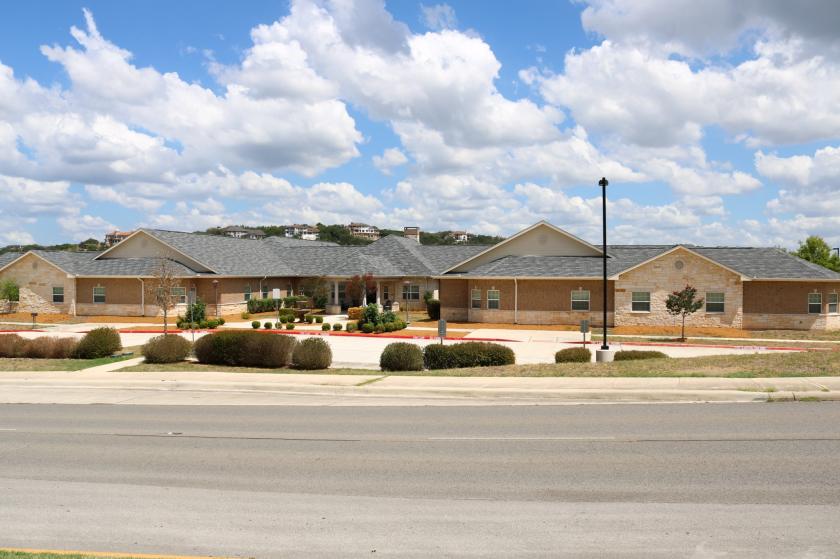
- • Former Memory Care Facility
- • 42 Units (all with plumbing/bathrooms)
- • Year Built: 2013
- • Commercial Kitchen
- • Outdoor patios and Walkways
- • Back-up Generator
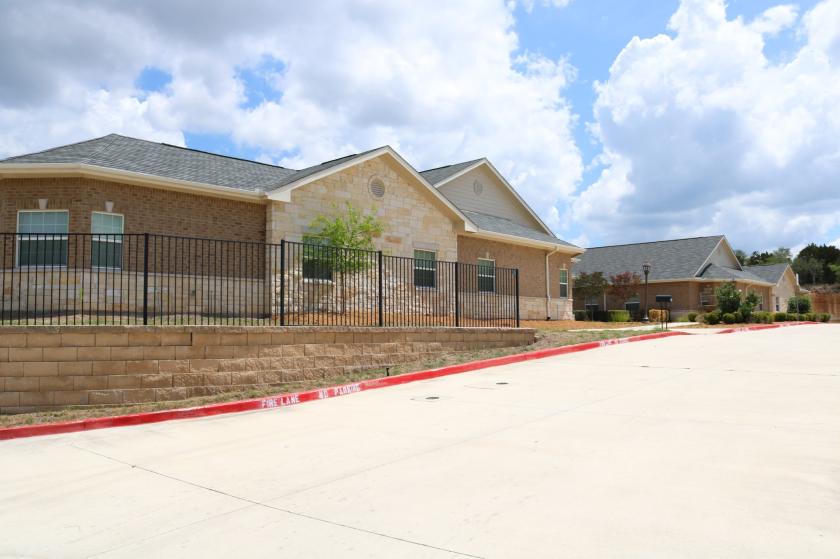
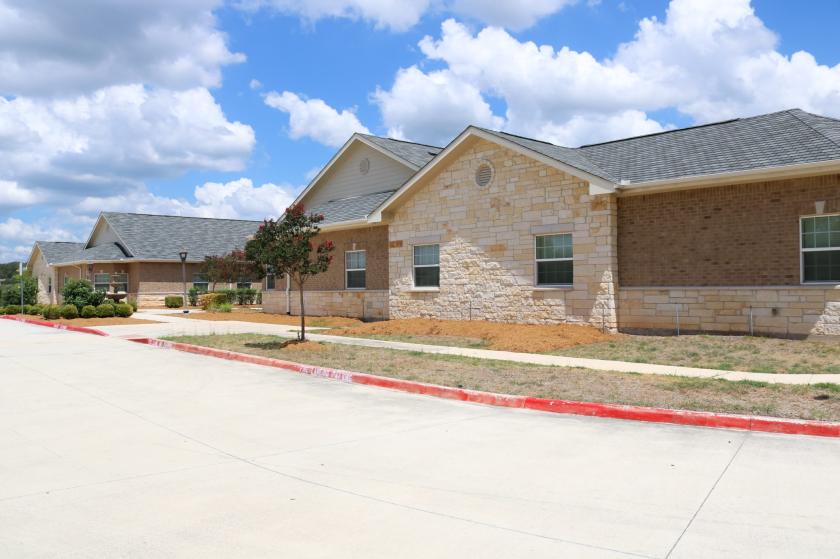
Additional Photos
Listing Agents

Adam Schiller
O: 210-742-6681
M: 210-232-4409
adam@valcorcre.com
O: 210-742-6681
M: 210-232-4409
adam@valcorcre.com

Sara Lombardi
Valcor CRE
O: 210-824-4242
M: 210-858-7907
sara@valcorcre.com
Valcor CRE
O: 210-824-4242
M: 210-858-7907
sara@valcorcre.com
While we strive to provide the most accurate information, all listing information, and demographic data, is provided by third-parties. As such, MyEListing will not be responsible for the accuracy of the information. It is strongly recommended that you verify all information with the listing agent, and any relevant agencies, prior to making any decisions.