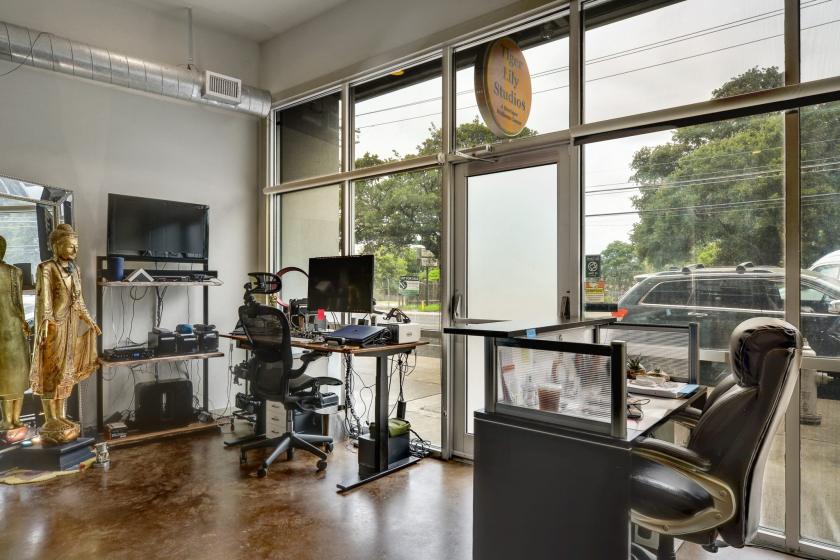
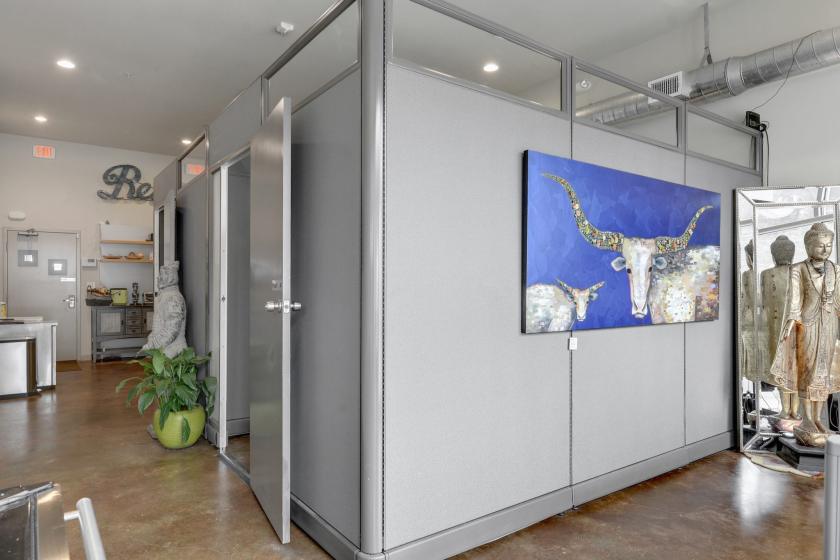
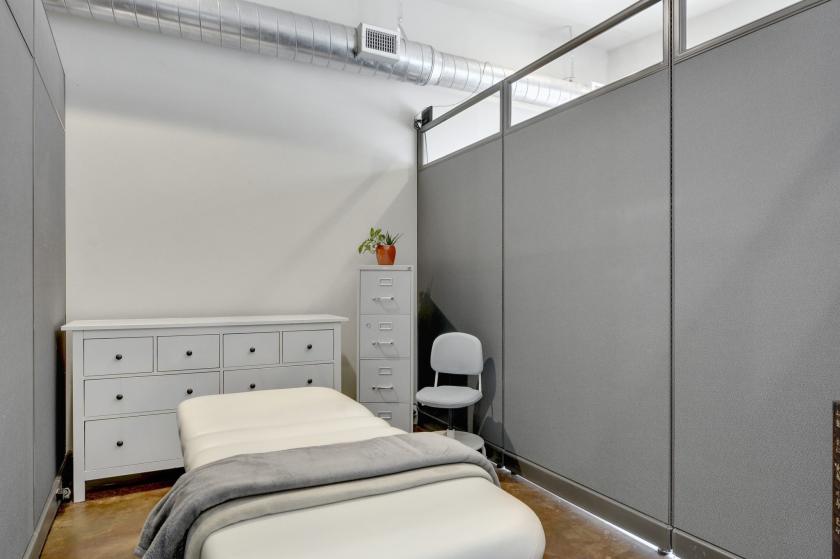
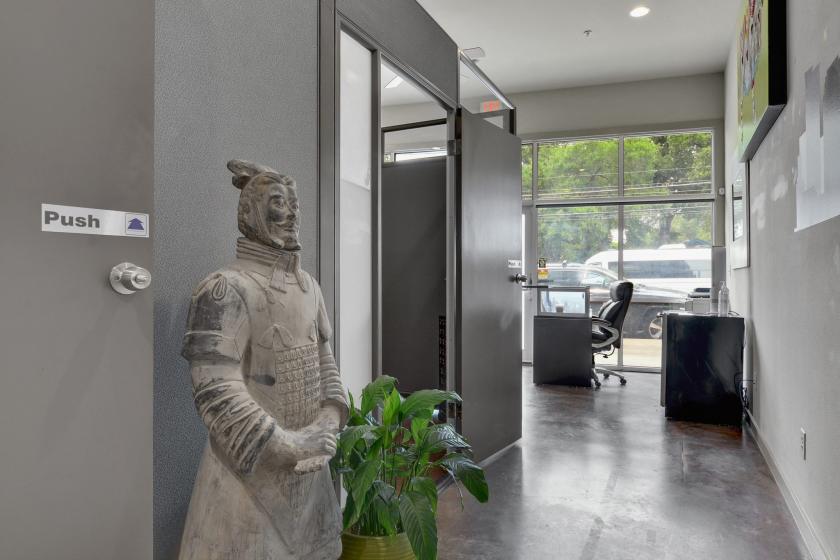
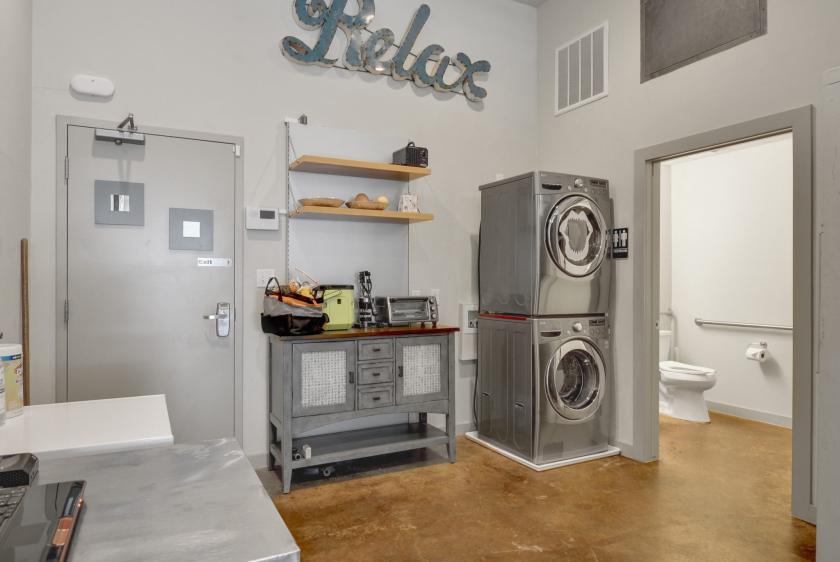
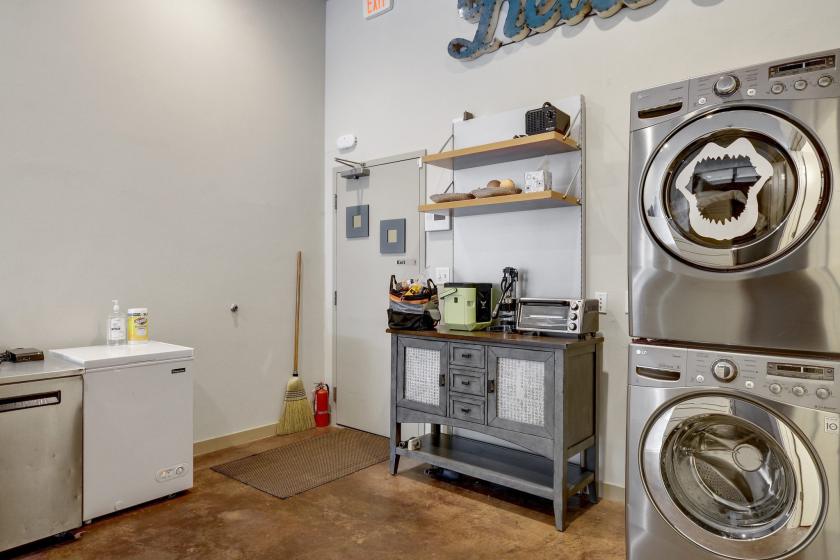
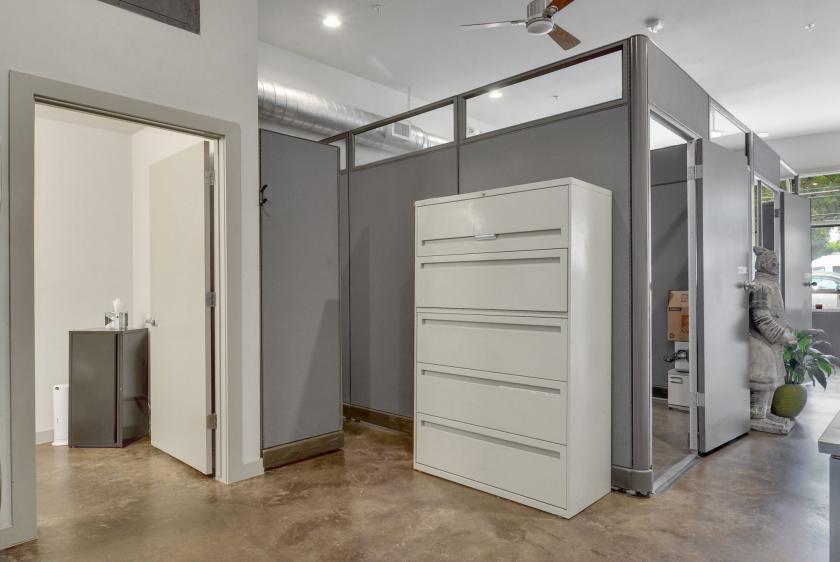
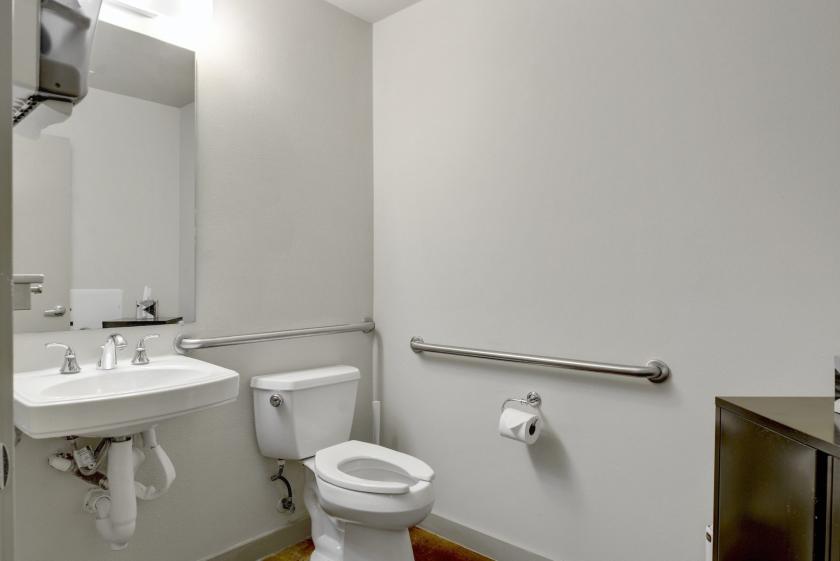
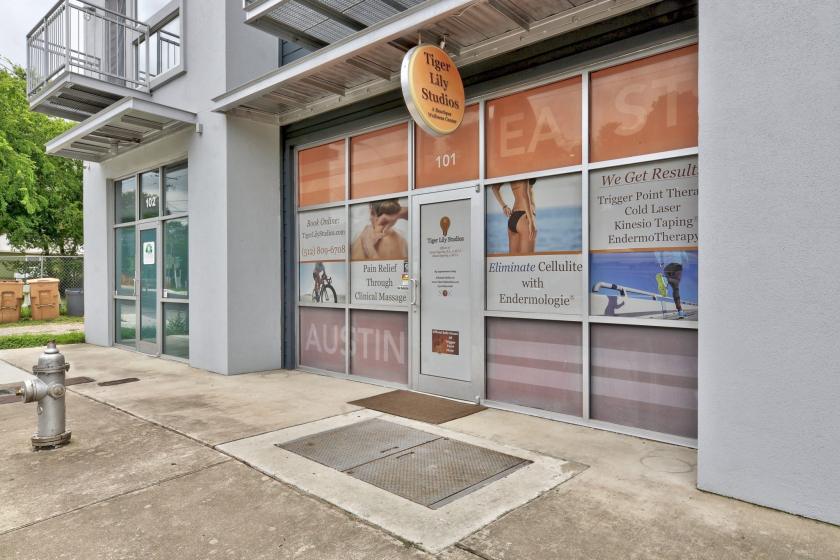
Retail Space
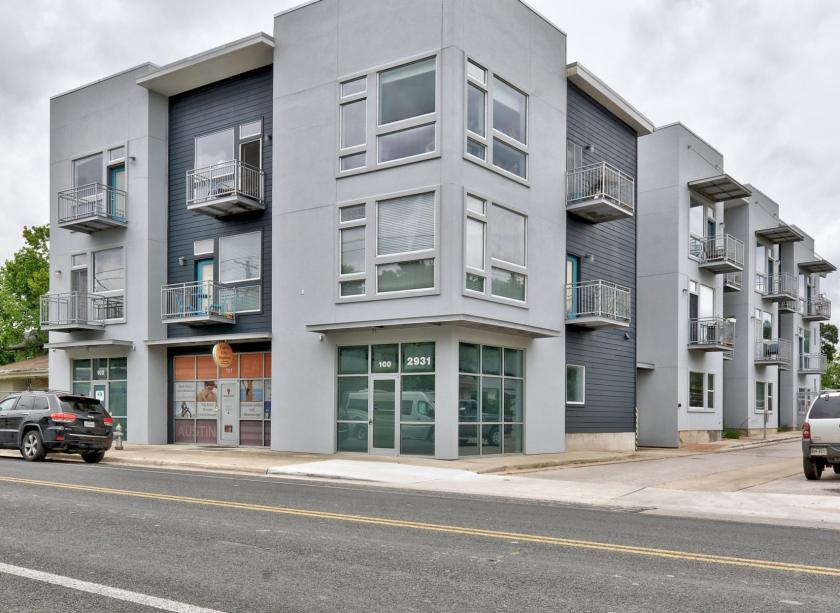
2931 E 12th St - Suite 101 Austin, TX 78702
2931 E 12th St - Suite 101 Austin, TX 78702
Details & Description
Property Highlights
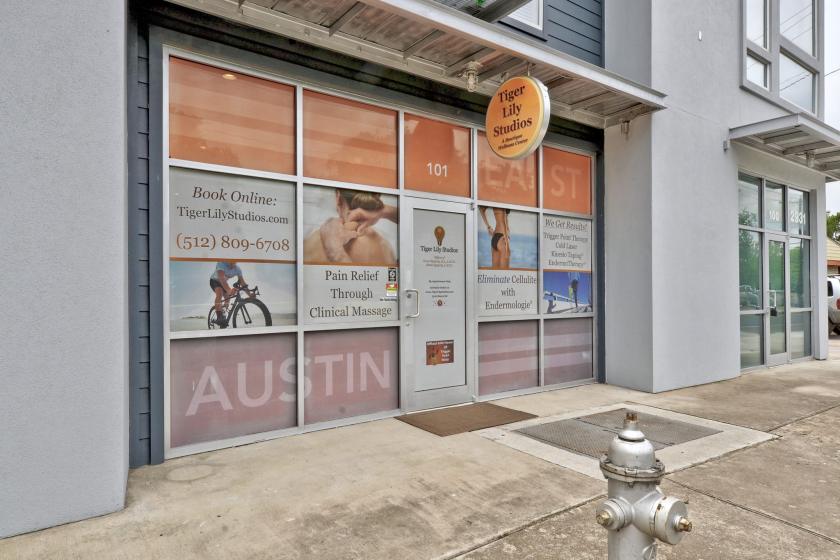
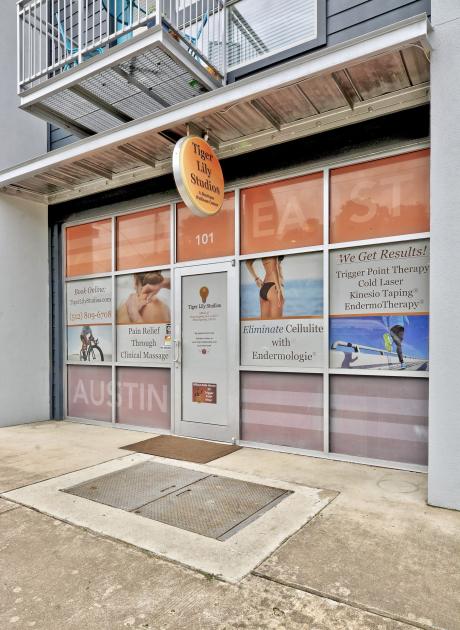
- • Prime Visibility
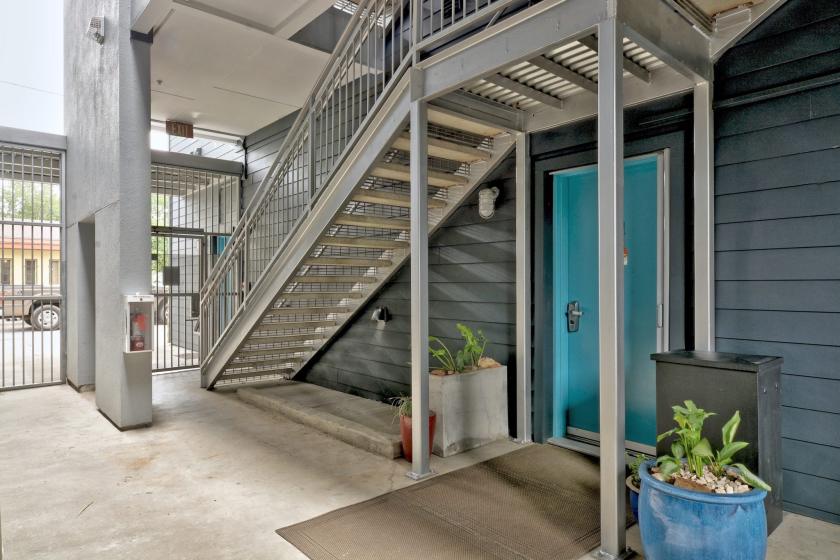
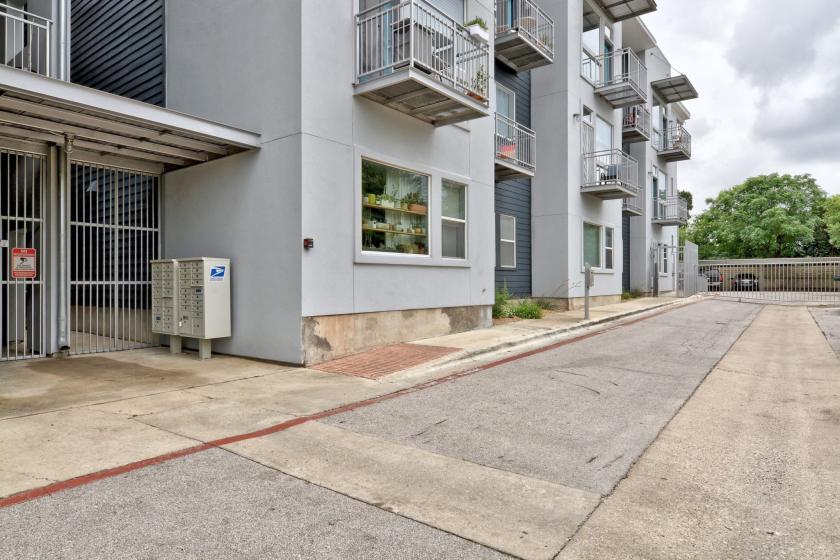
- • Two Covered Parking Spaces in Gated Lot
- • Multiple Zoning Uses
- • High-Security Biometric Locks
- • Window Advertising Allowed
Additional Photos

Listing Agents

Penn Bloxsom
O: 713-449-1024
pbloxsom@asterra.com
O: 713-449-1024
pbloxsom@asterra.com

Andrew Karr
O: 512-961-1883
akarr@asterra.com
O: 512-961-1883
akarr@asterra.com
While we strive to provide the most accurate information, all listing information, and demographic data, is provided by third-parties. As such, MyEListing will not be responsible for the accuracy of the information. It is strongly recommended that you verify all information with the listing agent, and any relevant agencies, prior to making any decisions.