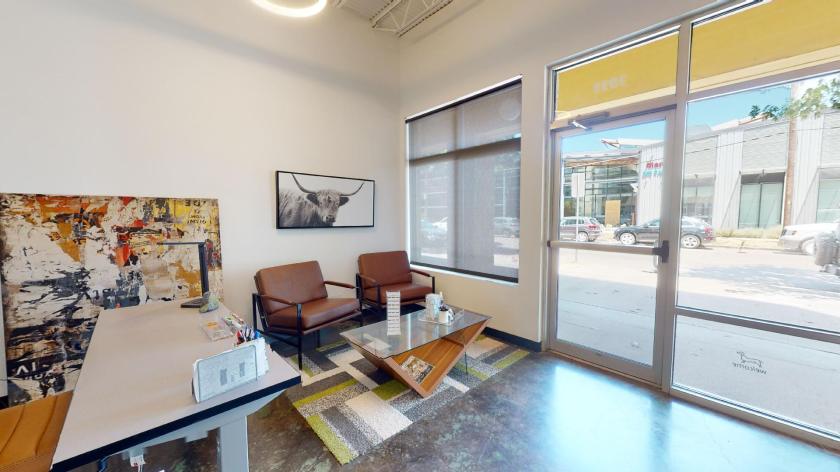
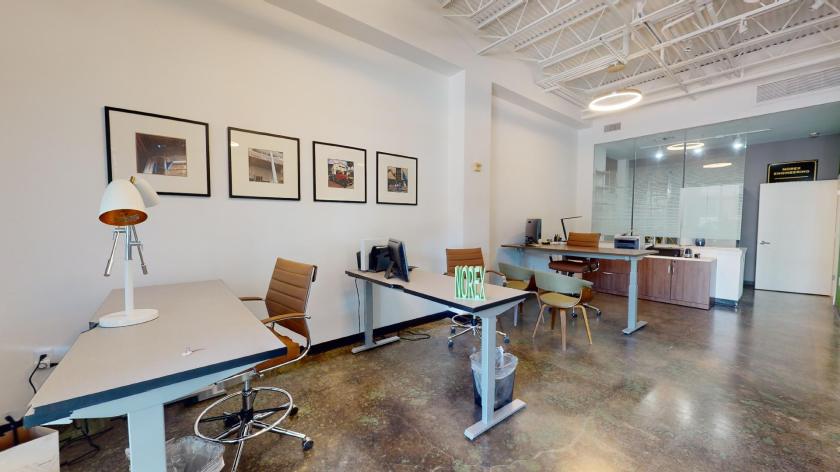
Office Space
2401 E 6th St - Suite 3035 Austin, TX 78702
2401 E 6th St - Suite 3035 Austin, TX 78702
Details & Description
Property Highlights
- • Walking (85) and biking scores(96)
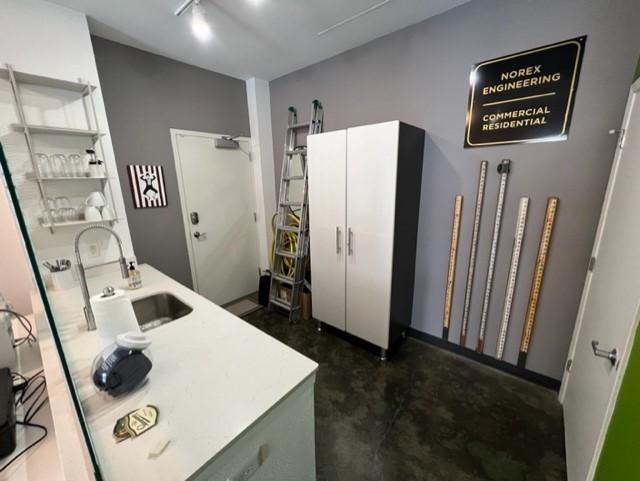
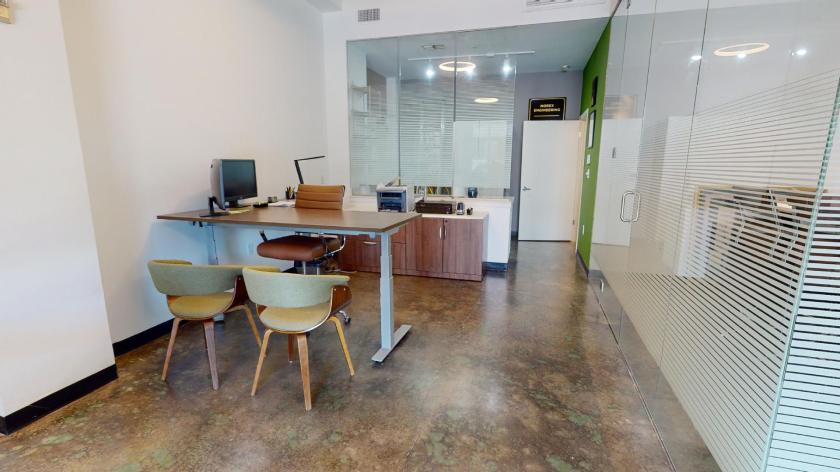
- • Kitchenette
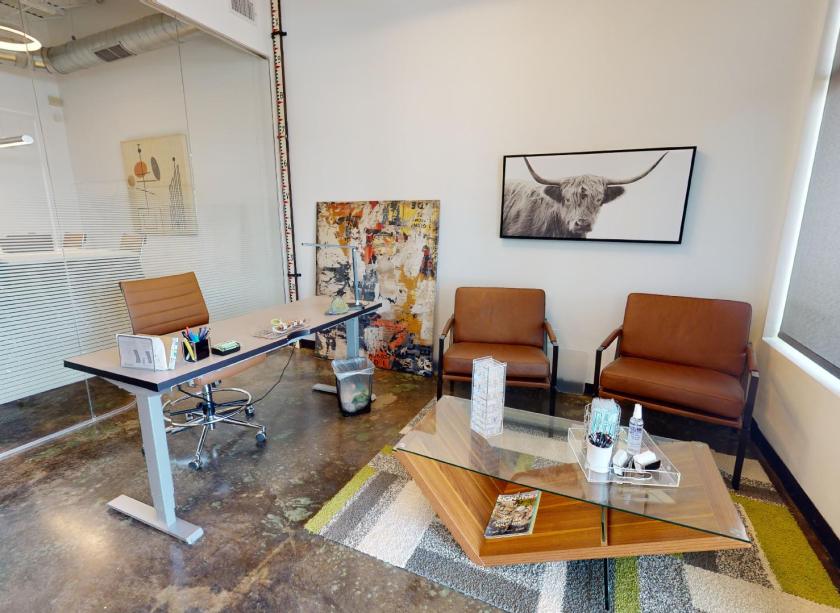
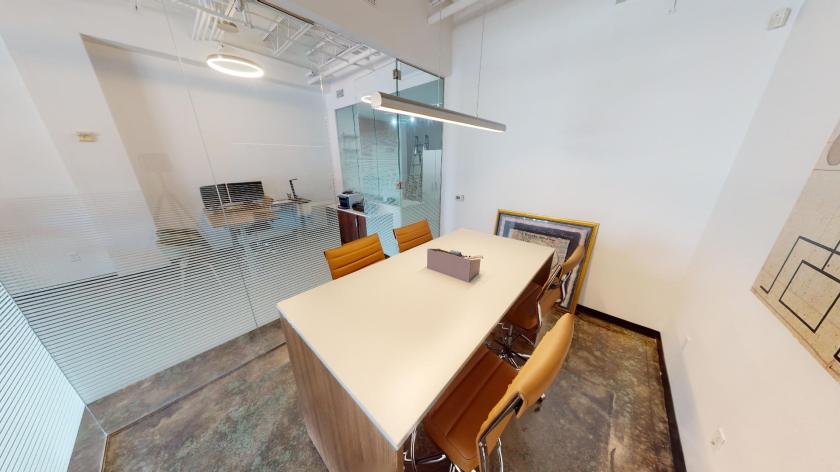
- • Conference room /Private suite
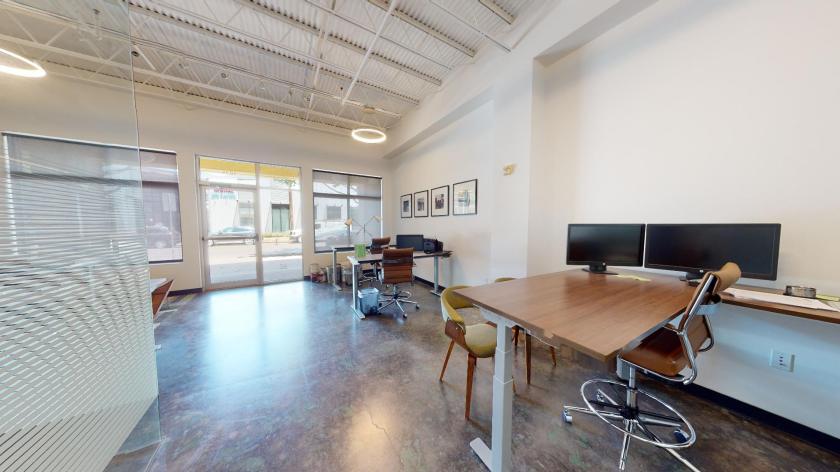
- • Update lighting fixtures and floors
- • High visibility
- • Abundant street parking
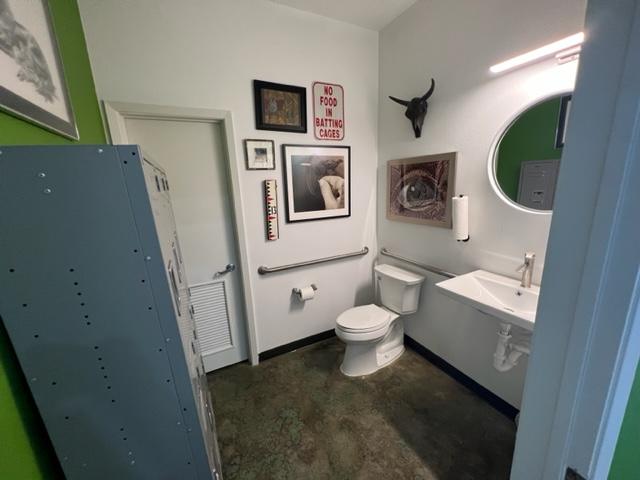
Additional Photos
Listing Agents

Penn Bloxsom
O: 713-449-1024
pbloxsom@asterra.com
O: 713-449-1024
pbloxsom@asterra.com
While we strive to provide the most accurate information, all listing information, and demographic data, is provided by third-parties. As such, MyEListing will not be responsible for the accuracy of the information. It is strongly recommended that you verify all information with the listing agent, and any relevant agencies, prior to making any decisions.