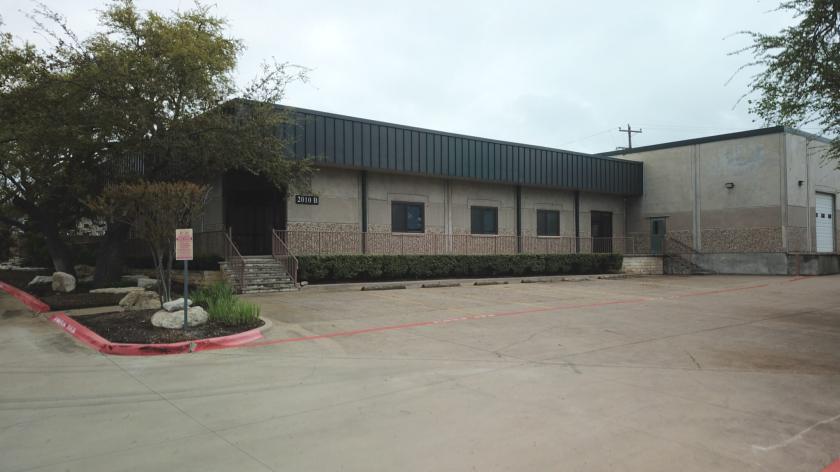
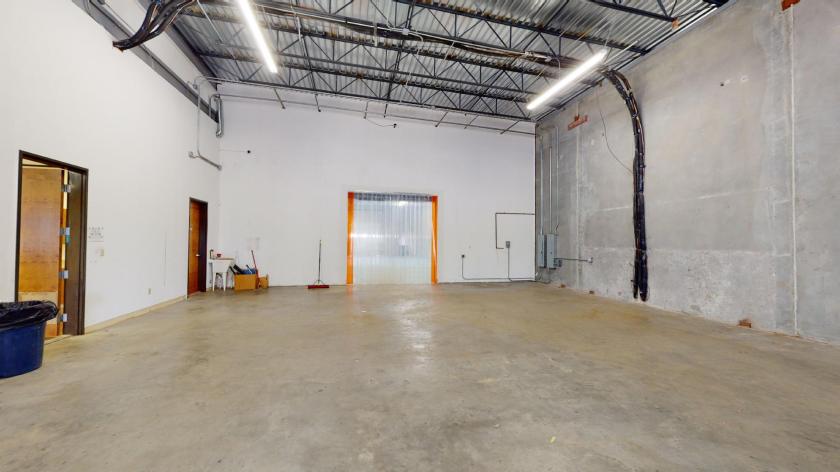
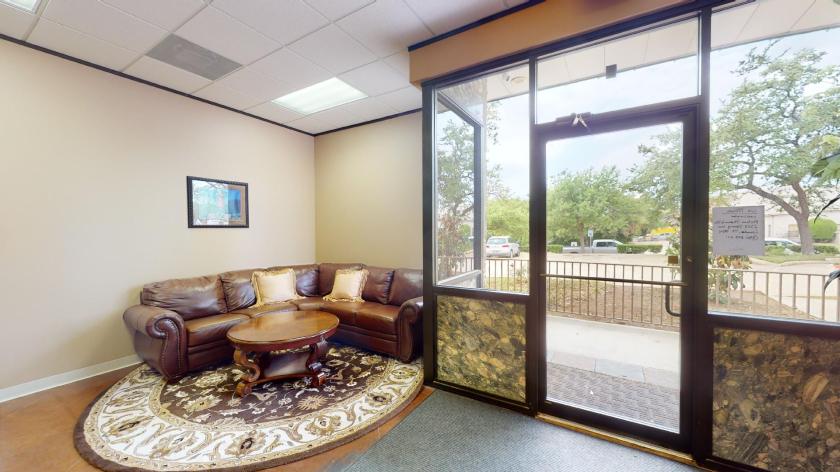
Flex-Office-Warehouse
2010 Windy Terrace Cedar Park, TX 78613
2010 Windy Terrace Cedar Park, TX 78613

Details & Description
Property Highlights
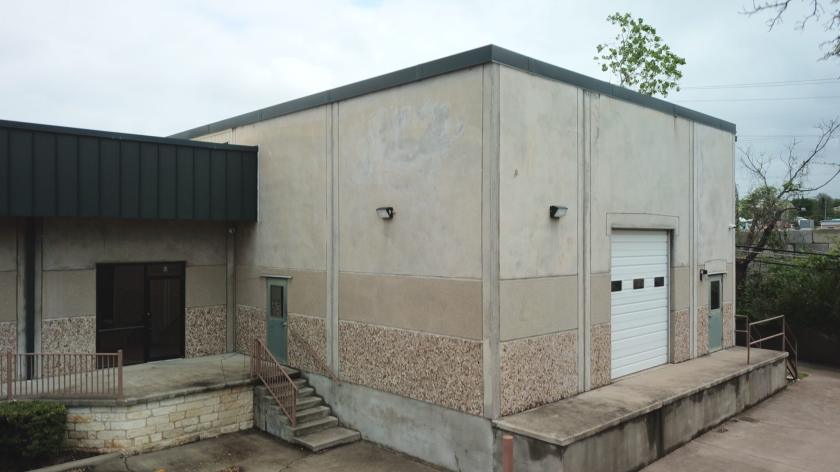
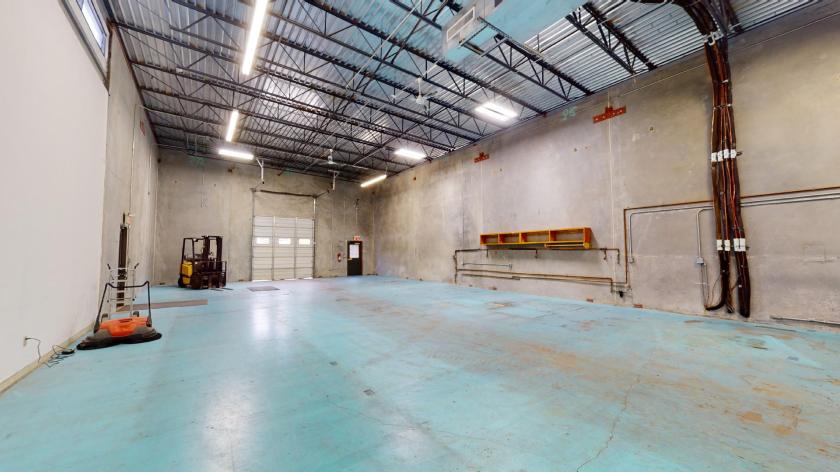
- • Dock High and Grade Level Loading Docks
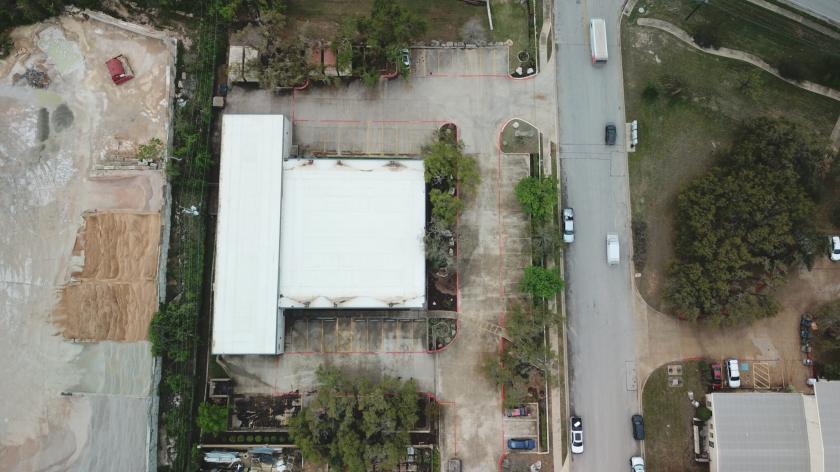
- • Hard Corner and Easy Accessible
- • Ample Parking
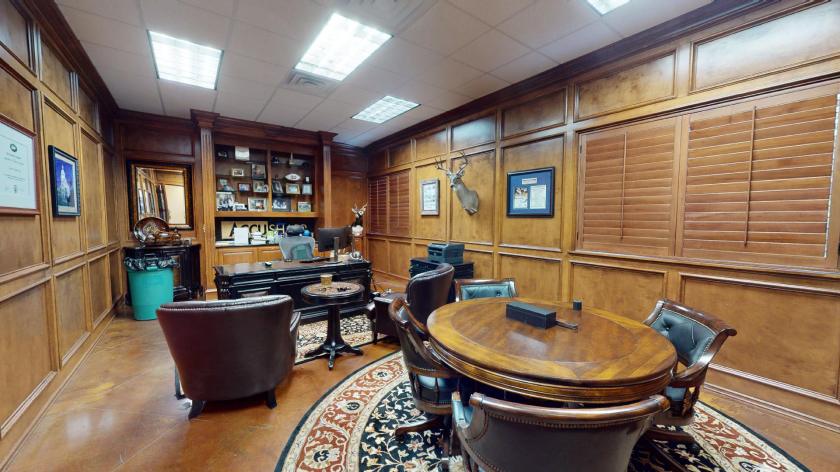
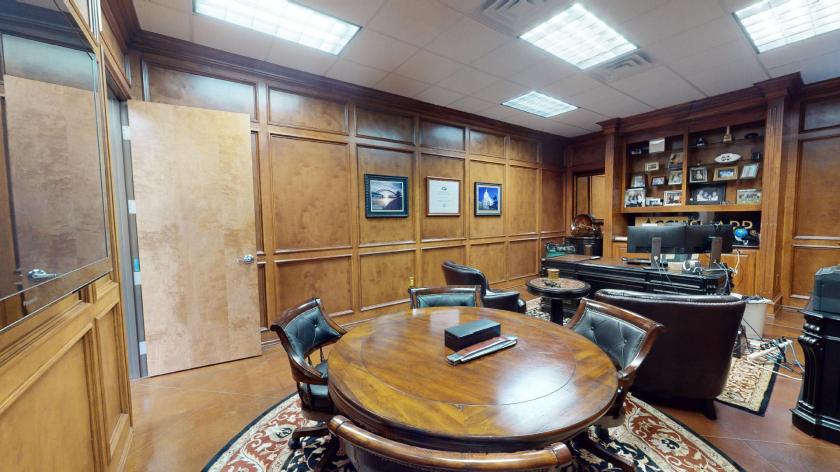
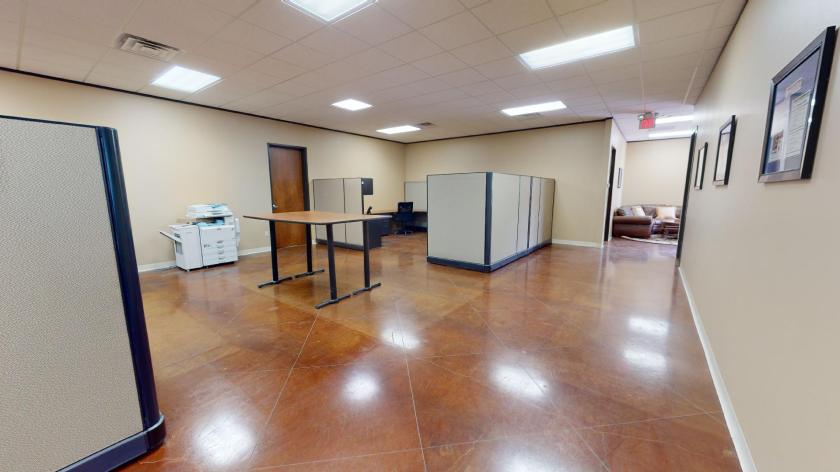
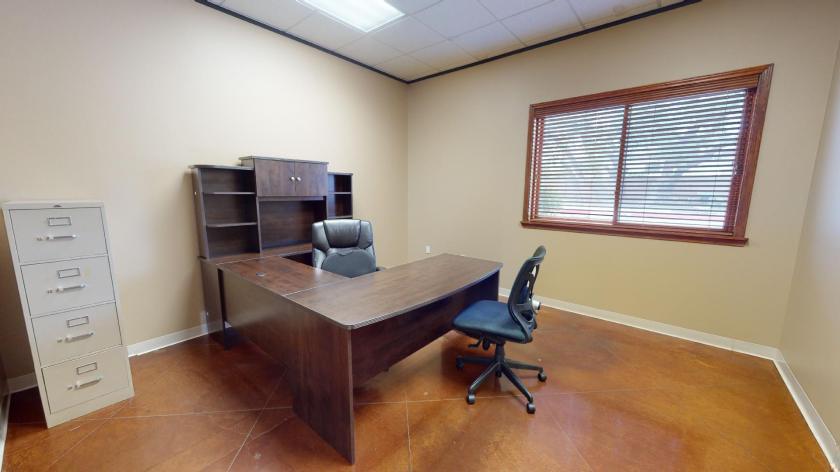
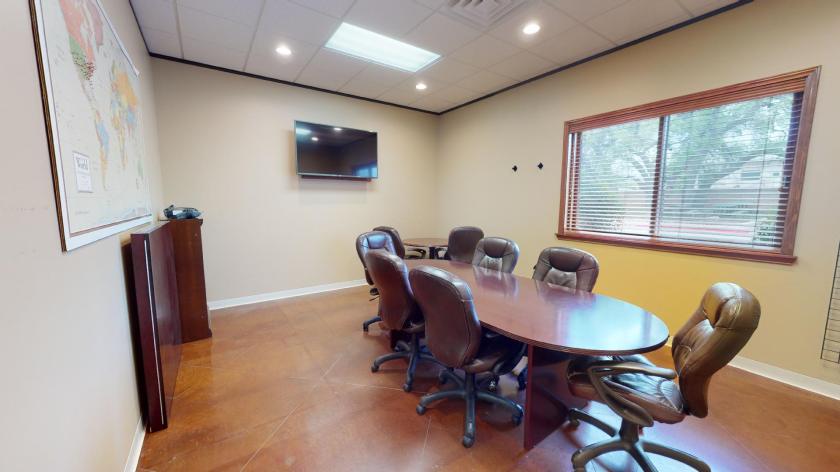
- • 10 Private Offices
- • Ideally Located
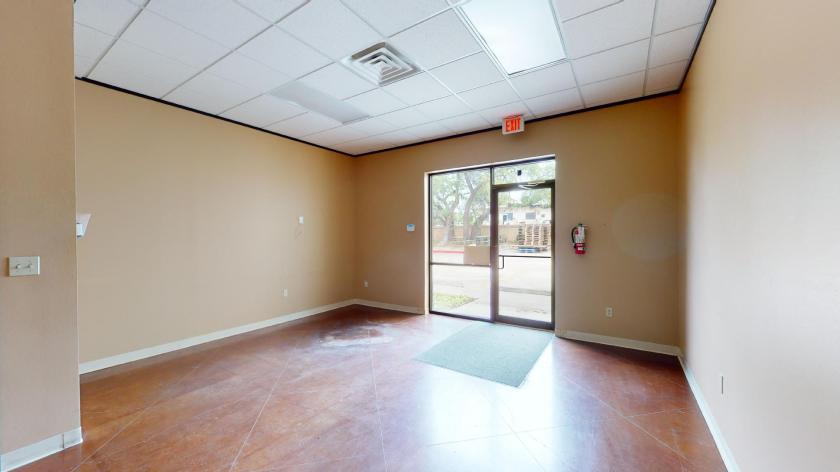
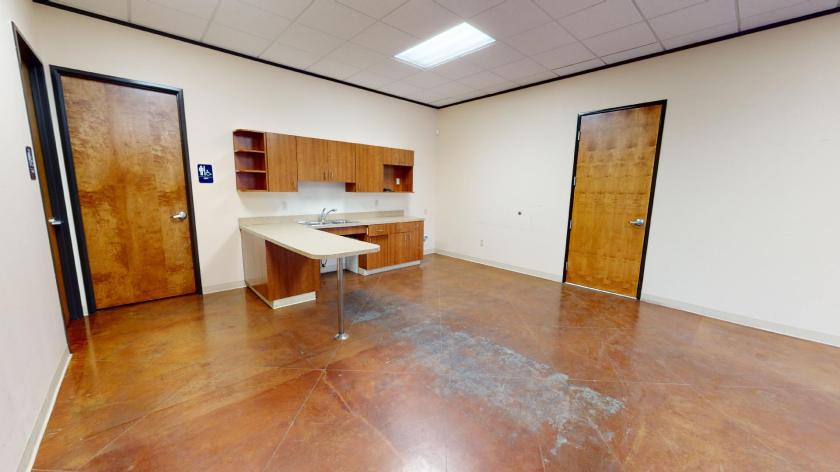
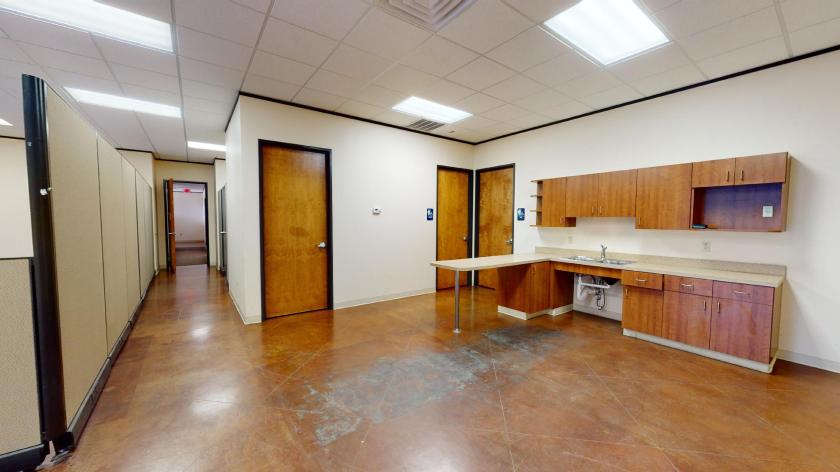
Additional Photos

Listing Agents

Matt Rester
Asterra Properties
O: 512-750-8270
mrester@asterra.com
Asterra Properties
O: 512-750-8270
mrester@asterra.com

Lucian Morehead
O: 512-825-6287
lmorehead@asterra.com
O: 512-825-6287
lmorehead@asterra.com
While we strive to provide the most accurate information, all listing information, and demographic data, is provided by third-parties. As such, MyEListing will not be responsible for the accuracy of the information. It is strongly recommended that you verify all information with the listing agent, and any relevant agencies, prior to making any decisions.