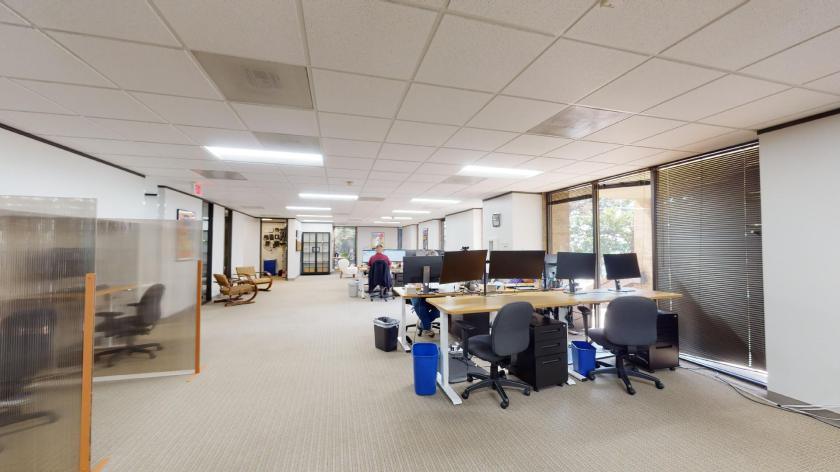
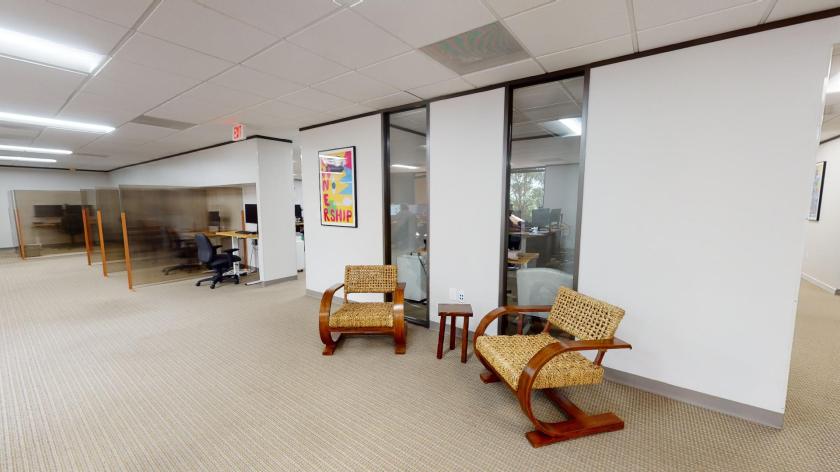
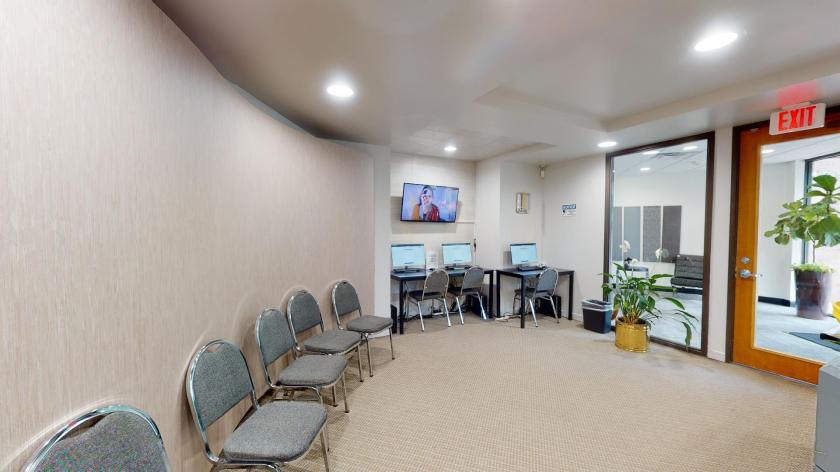
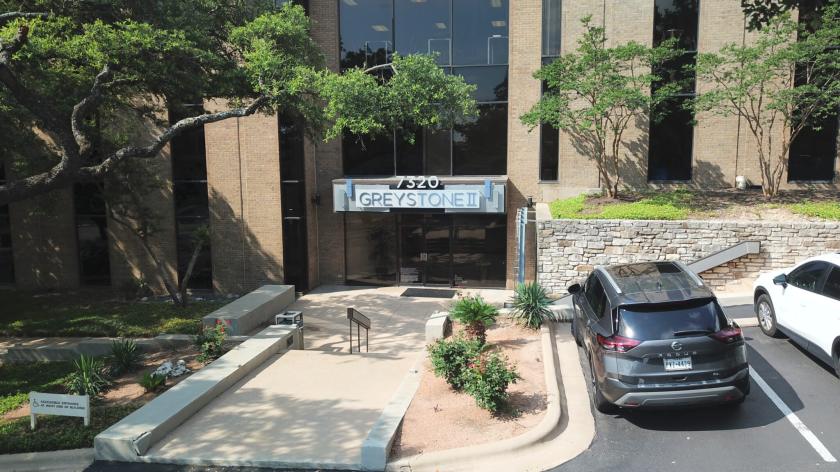
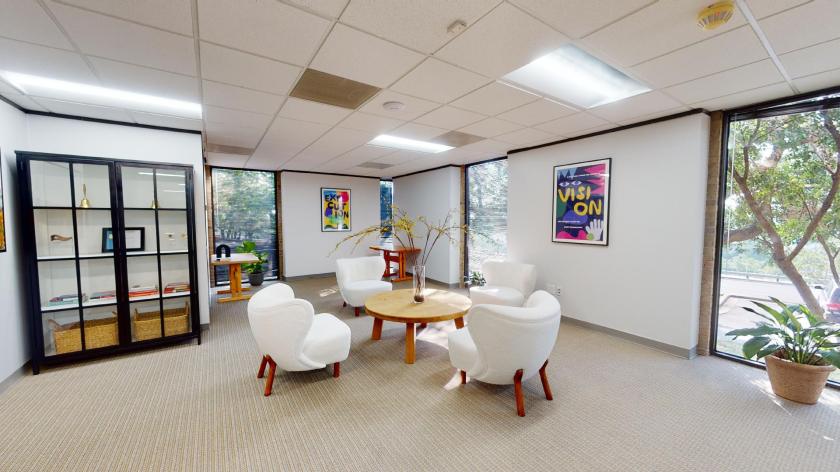
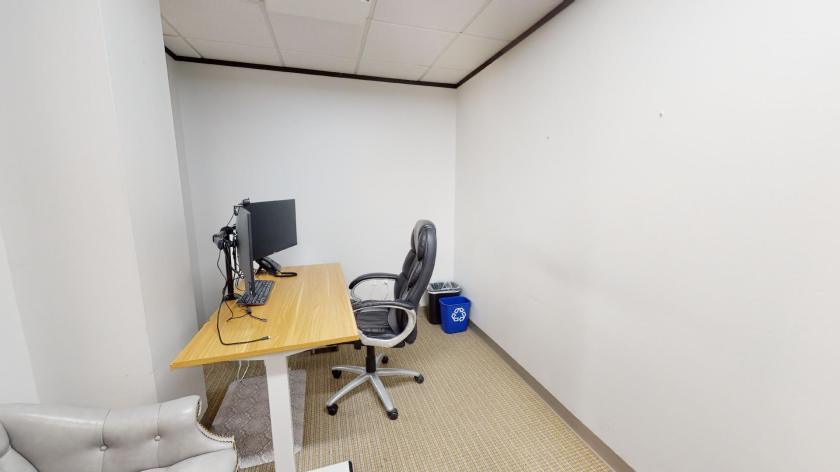
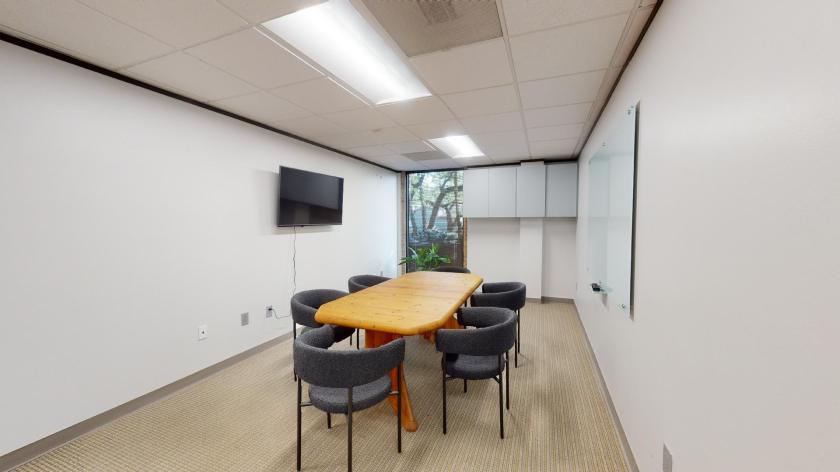
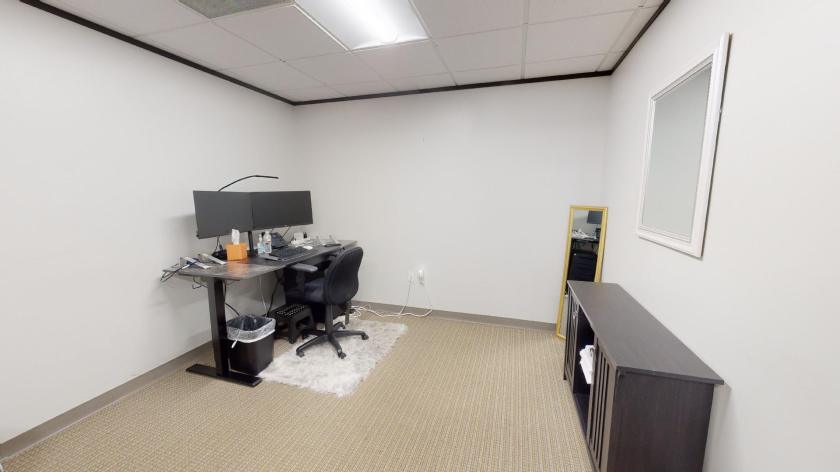
Office Space
7320 North Mopac Expressway Austin, TX 78731
7320 North Mopac Expressway Austin, TX 78731

Details & Description
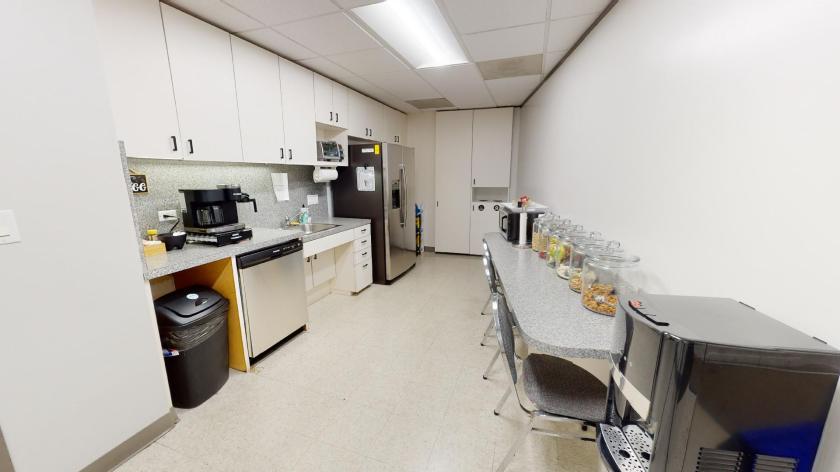
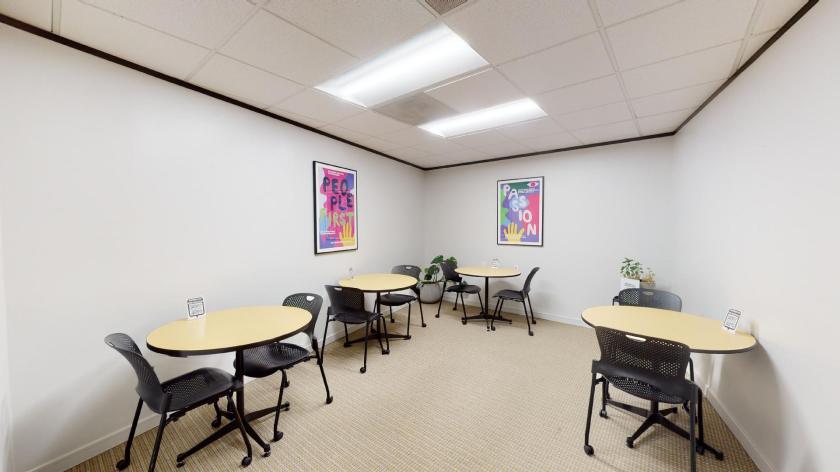
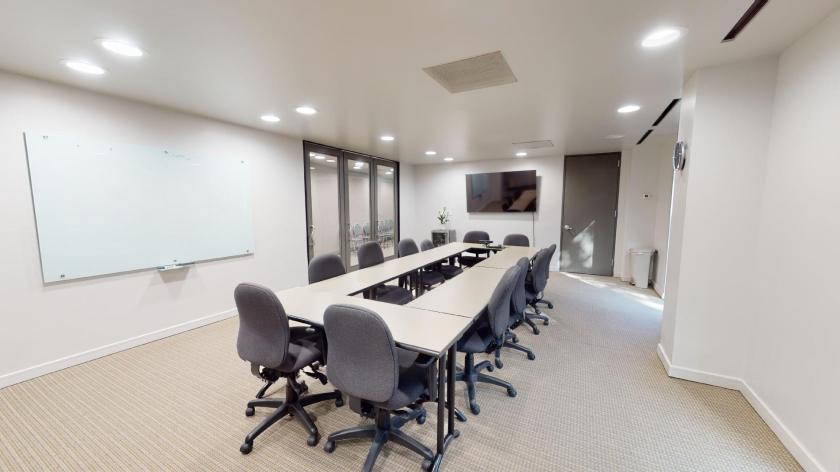
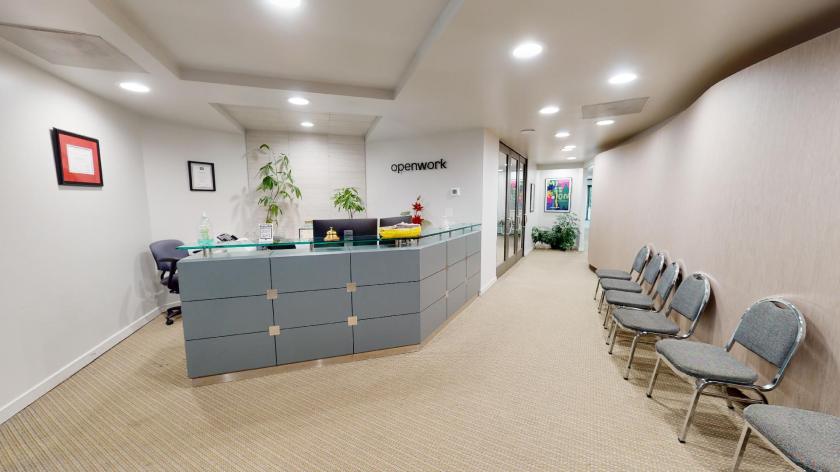
Additional Photos
Listing Agents

Matt Rester
Asterra Properties
O: 512-750-8270
mrester@asterra.com
Asterra Properties
O: 512-750-8270
mrester@asterra.com

Lucian Morehead
O: 512-825-6287
lmorehead@asterra.com
O: 512-825-6287
lmorehead@asterra.com
While we strive to provide the most accurate information, all listing information, and demographic data, is provided by third-parties. As such, MyEListing will not be responsible for the accuracy of the information. It is strongly recommended that you verify all information with the listing agent, and any relevant agencies, prior to making any decisions.