Office Space
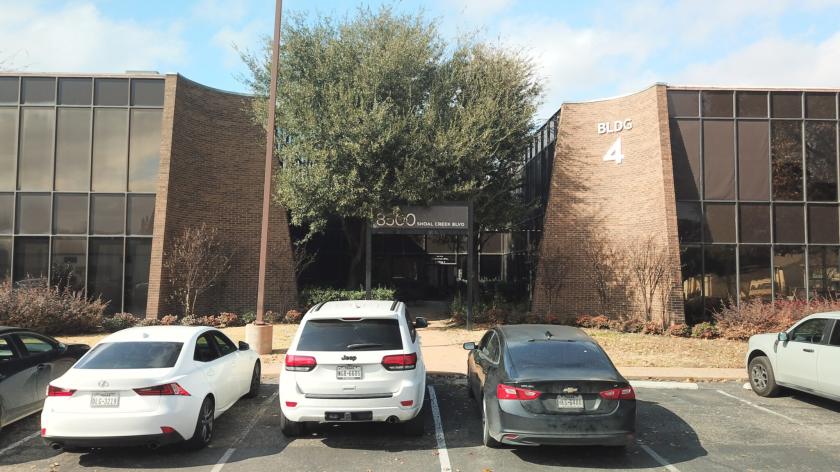
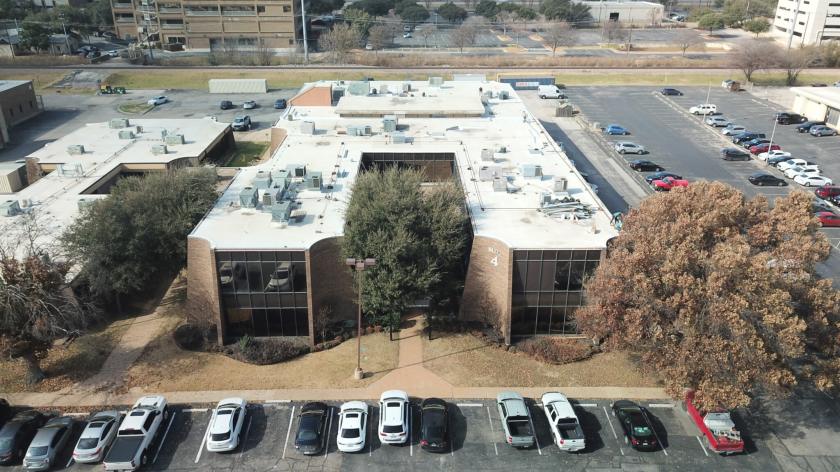
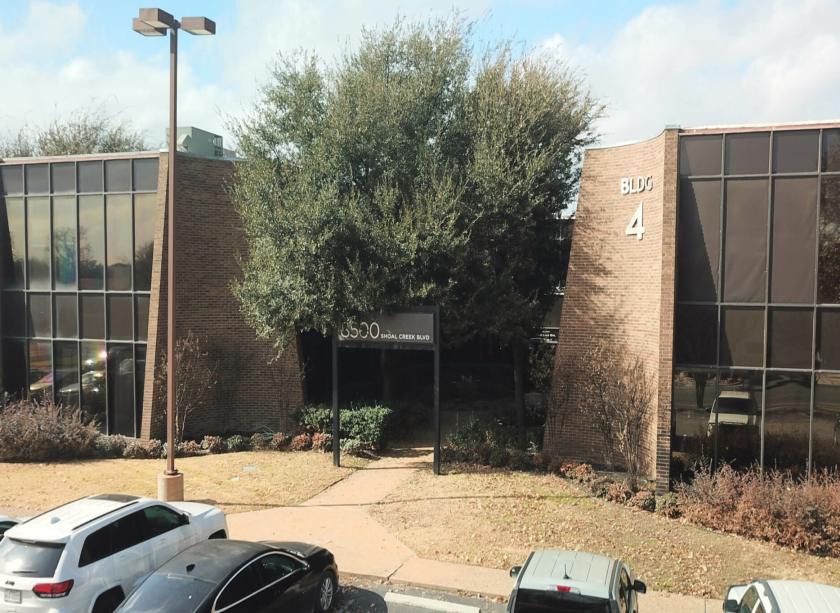
8500 Shoal Creek Boulevard Austin, TX 78757
8500 Shoal Creek Boulevard Austin, TX 78757
Details & Description
Property Highlights
- • Ideally Located
- • Ample Parking
- • Easy Access to Major Roadways
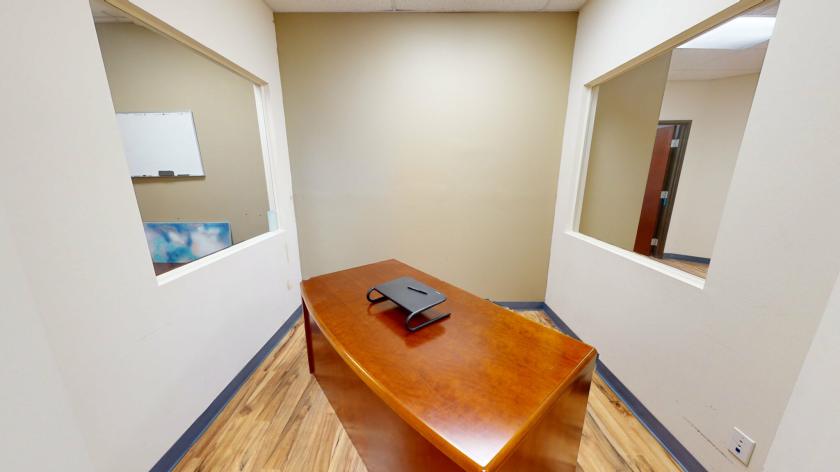
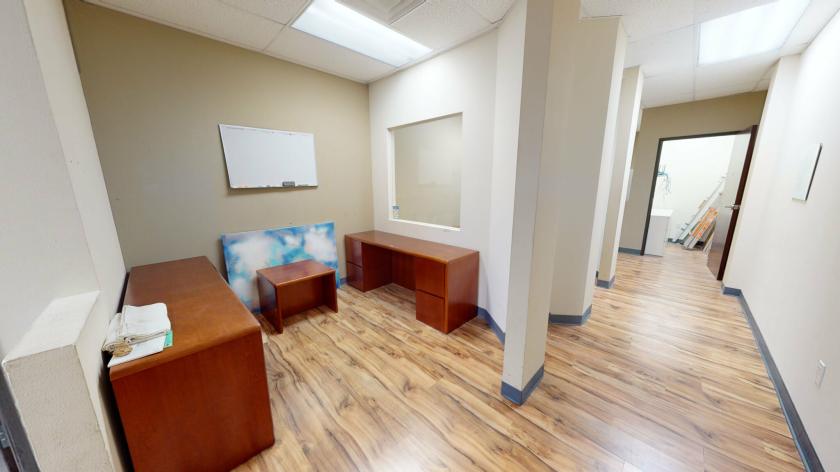
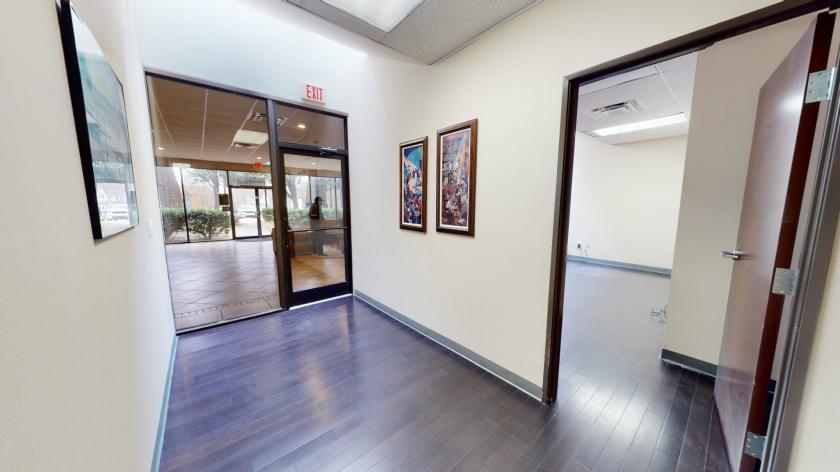
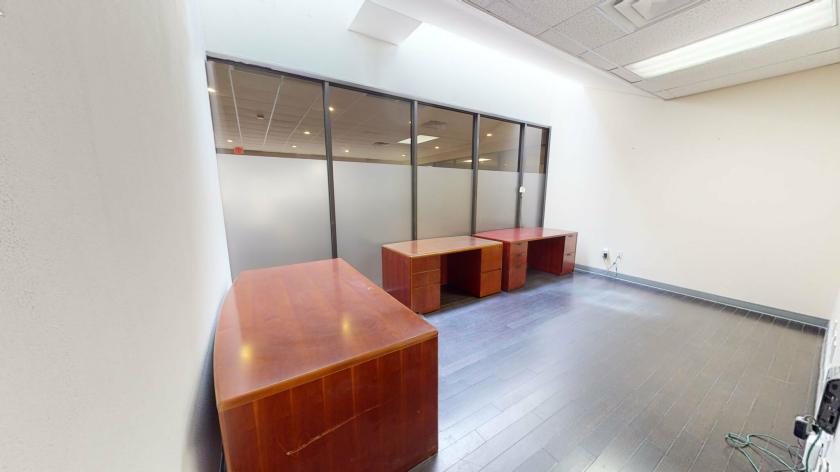
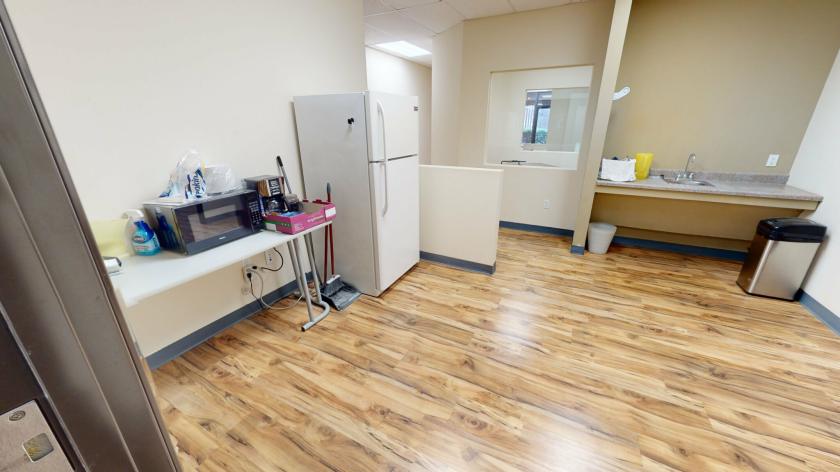
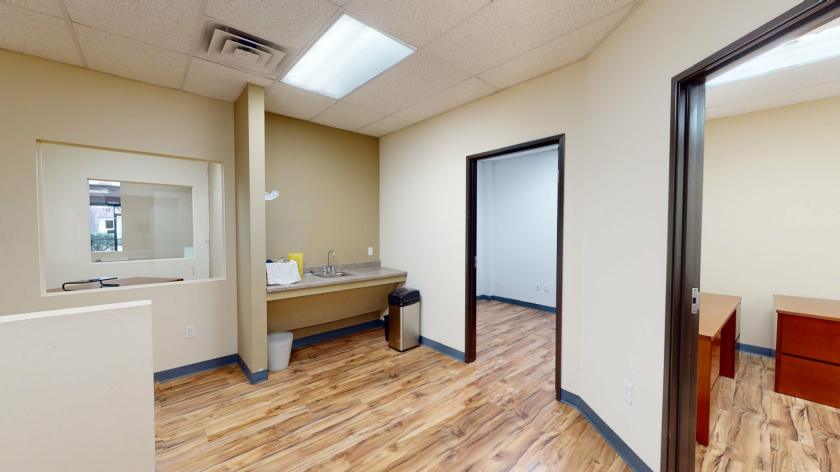
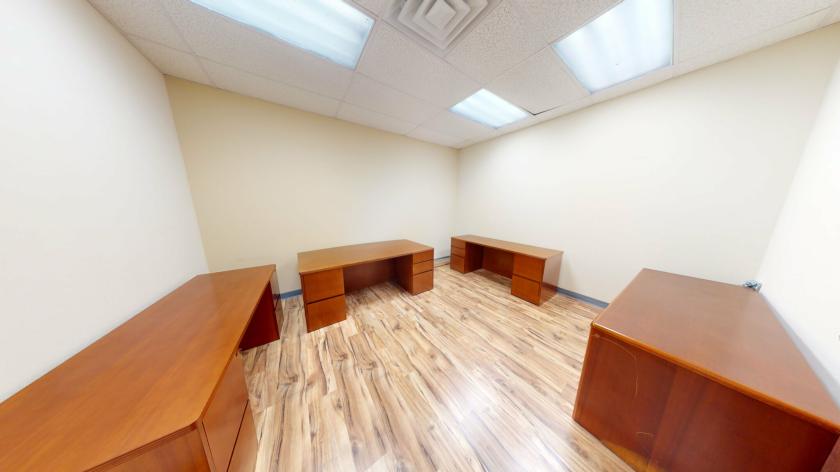
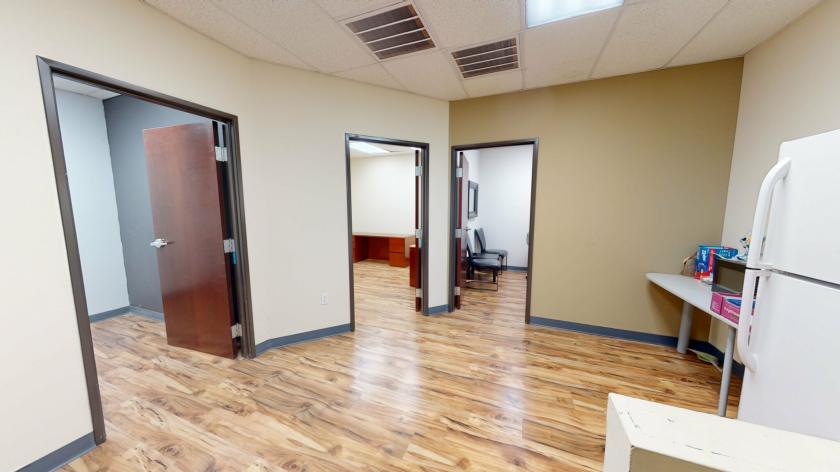
Additional Photos
Listing Agents

Andrew Karr
O: 512-961-1883
akarr@asterra.com
O: 512-961-1883
akarr@asterra.com

Penn Bloxsom
O: 713-449-1024
pbloxsom@asterra.com
O: 713-449-1024
pbloxsom@asterra.com
While we strive to provide the most accurate information, all listing information, and demographic data, is provided by third-parties. As such, MyEListing will not be responsible for the accuracy of the information. It is strongly recommended that you verify all information with the listing agent, and any relevant agencies, prior to making any decisions.