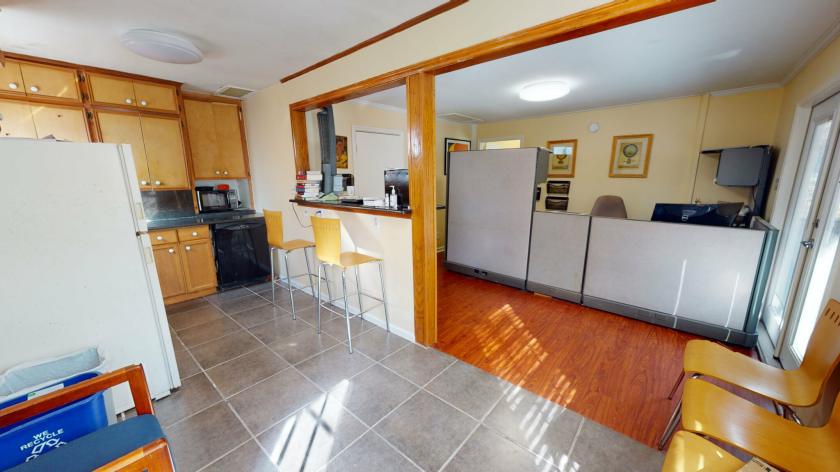
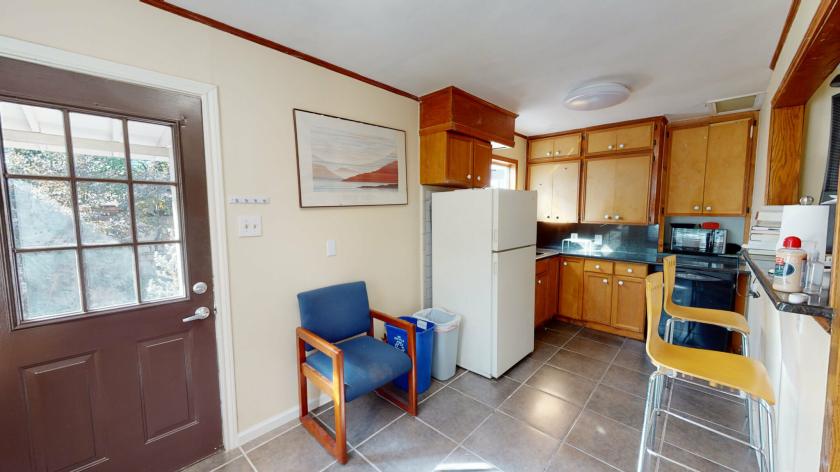
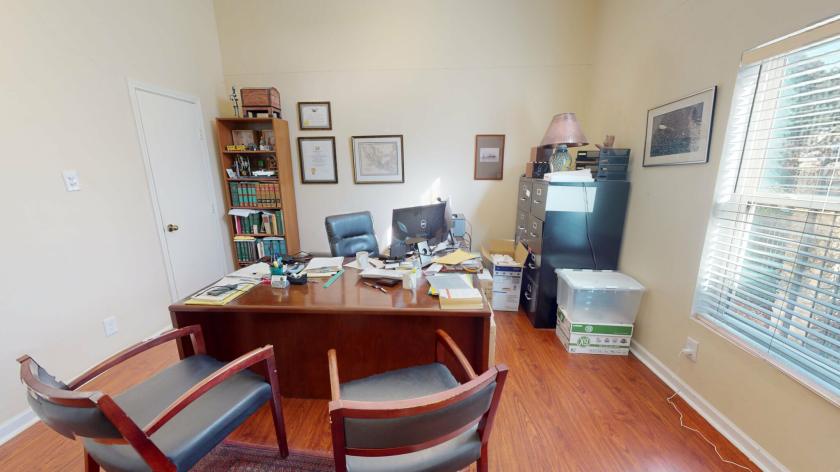
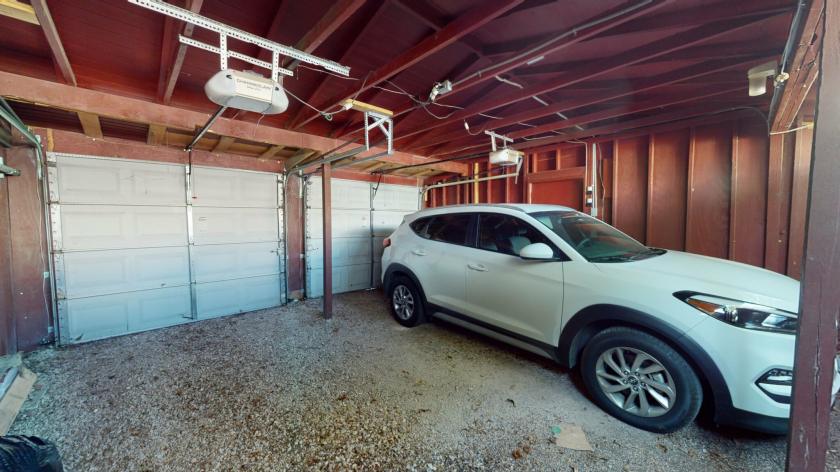
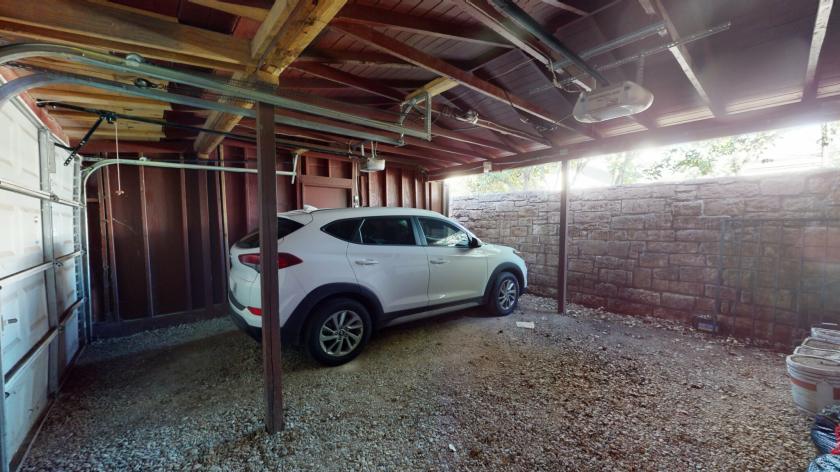
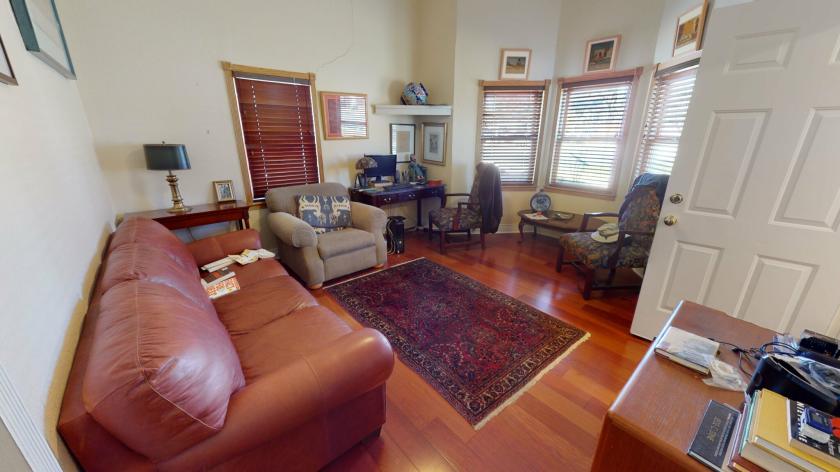
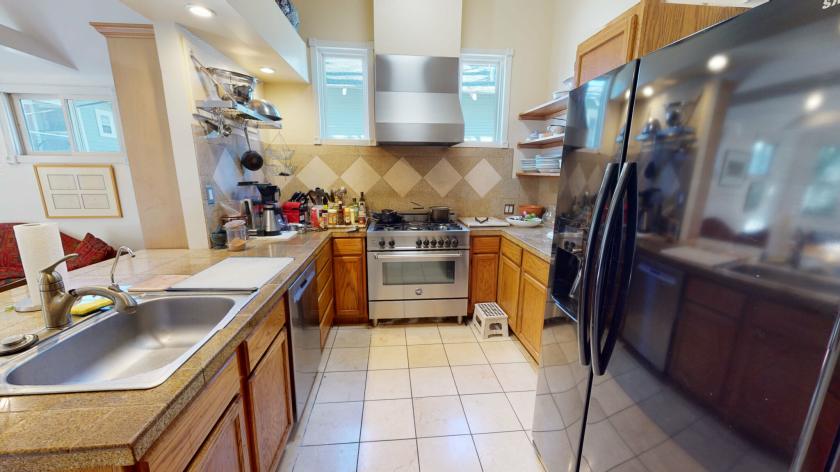
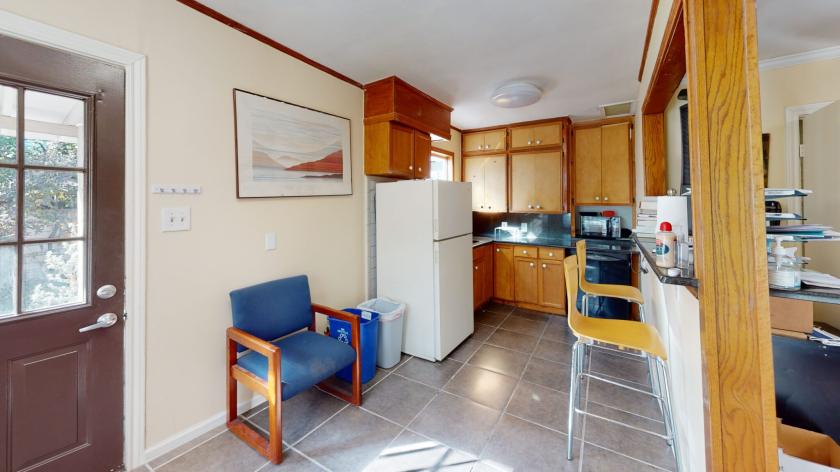
Everything is within a short walk, bike ride or drive when you come to 1607 E 7th St. This property sits in the center of booming East Austin and all the amenities, bars and restaurants that are flourishing on East 5th-7th St. This property can be used in a vast array of uses including a great opportunity to live-work because of the layout and configuration of the buildings on this property. Looking for an investment property that can hold multiple tenants? 1607 E 7th has three (3) individual spaces that can be used for office, retail or residential purposes. The property is a block away from E 6th st less than a mile away from 6th St and one and half miles from the Capitol and Downtown Austin.1607 E 7th consists of two buildings totaling approximately 2,039 SF (per TCAD). Building A is a single-story split home/office with approximately 1,366 SF (per TCAD). The two sides of building A are completely separate from each other and have access from both E 7th St and the alley in back of the property; perfect for an owner looking for a live-work opportunity. Building B located in back of the property and adjacent to the alley, is a garage apartment with approximately 673 SF of space. The Property is zoned TOD and is a mere two blocks from the Plaza Saltillo Station and a short walk to The Foundry development (95,000 SF mixed use project under development), and also The Arnold a 346 SF-unit mixed-use apartment complex. This property is a few blocks from the new HQ Onion Street West development (315,000 SF currently under construction), and within eye sight of Easy Tiger and Ramen Tatsu-Yat, just to name a few.The property has full utilities including existing electric and water services and features access to both 7th Street and the alley behind the property which runs from Comal St to Chalmers Ave. Parking is located in the back through the alleyway and features a two-car garage.