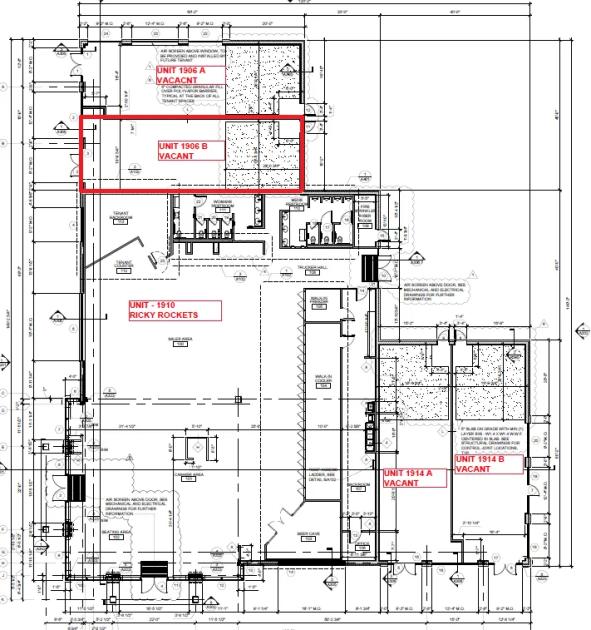
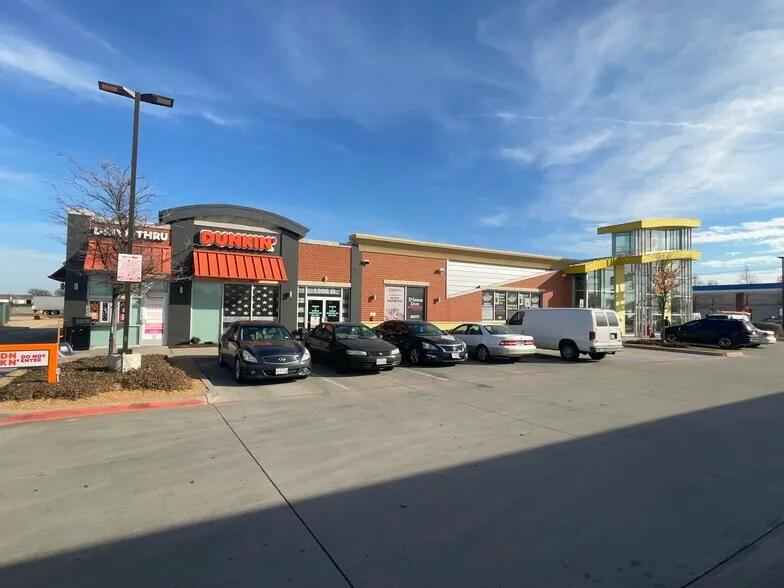
1-Mile | 3-Miles | 5-Miles | ||
---|---|---|---|---|
Total Population | 1,313 | 156,310 | 414,419 | |
Population Median Age | 31 | 34 | 35 | |
Population by Age | 0-9 Yrs | 218 (16%) | 26469 (16%) | 63063 (15%) |
10-19 Yrs | 345 (26%) | 20237 (12%) | 54858 (13%) | |
20-29 Yrs | 90 (6%) | 23572 (15%) | 64563 (15%) | |
30-39 Yrs | 218 (16%) | 25101 (16%) | 62826 (15%) | |
40-49 Yrs | 211 (16%) | 21317 (13%) | 52907 (12%) | |
50-59 Yrs | 82 (6%) | 16876 (10%) | 48815 (11%) | |
60-69 Yrs | 69 (5%) | 12957 (8%) | 36887 (8%) | |
70+ Yrs | 80 (6%) | 9781 (6%) | 30499 (7%) | |
Median HH Income | $47,408 | $51,382 | $56,634 | |
Total Household Income | < 24K | 55 (14%) | 11456 (20%) | 26446 (17%) |
25-49K | 182 (46%) | 15915 (28%) | 39341 (26%) | |
50-74K | 73 (18%) | 10590 (18%) | 28376 (19%) | |
75-99K | 40 (10%) | 6107 (10%) | 18169 (12%) | |
100-199K | 40 (10%) | 8615 (15%) | 26768 (18%) | |
200K+ | 1 (0%) | 3438 (6%) | 9306 (6%) | |
Highest Education Level | No Diploma | 142 | 22431 | 53308 |
Diploma or GED | 304 | 22739 | 60799 | |
Some College | 170 | 21020 | 56177 | |
Assoc. Degree | 29 | 5787 | 17524 | |
Bachelors Degree | 23 | 16802 | 51277 | |
Higher Degree | 30 | 10085 | 27684 | |
Total Housing Units | 439 | 60,884 | 161,183 | |
--Owner-Occupied | 217 | 24,498 | 71,630 | |
--Renter-Occupied | 173 | 31,623 | 76,777 | |
Owner-Occupied Values | < 100K | 91 | 2645 | 7757 |
100-199K | 105 | 9337 | 28967 | |
200-299K | 21 | 5526 | 17606 | |
300-399K | 0 | 2949 | 7760 | |
400-499K | 0 | 1728 | 4164 | |
500K+ | 0 | 2313 | 5375 | |
Total Working Age Population | 903 | 117,100 | 316,652 | |
In Work Force | 645 | 83,542 | 222,620 | |
Not In Work Force | 258 | 33,558 | 94,032 | |
Workforce Employed | 630 | 79,766 | 211,883 | |
Workforce Unemployed | 15 | 3,700 | 10,549 | |
Civlian Workforce | 645 | 83,467 | 222,432 | |
Military Workforce | 0 | 75 | 188 | |
Total Households | 391 | 56,121 | 148,407 | |
Family Households | 273 | 36,581 | 97,331 | |
Non-Family Households | 117 | 19,540 | 51,076 | |
Married Couple | 167 | 24,224 | 67,252 | |
Other Family | 106 | 12,357 | 30,079 | |
Married w/Child | 119 | 11,988 | 31,337 | |
Single Male w/Child | 1 | 1,783 | 3,870 | |
Single Female w/Child | 62 | 4,854 | 10,787 |
Population Change Last Two Decades - Plus Projection
2000 | % | 2010 | % | 2020 | % | 2030 | |
---|---|---|---|---|---|---|---|
Texas | 20,851,820 | +21 | 25,145,561 | +18 | 29,677,668 | +18 | 34,894,452 |
Dallas County | 2,218,899 | +7 | 2,368,139 | +15 | 2,734,111 | +14 | 3,106,298 |
Total Working Age Population:
Total Households:
Total Working Age Population:
Total Households:
Total Working Age Population:
Total Households: