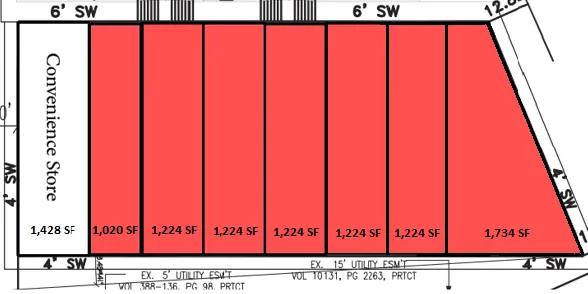
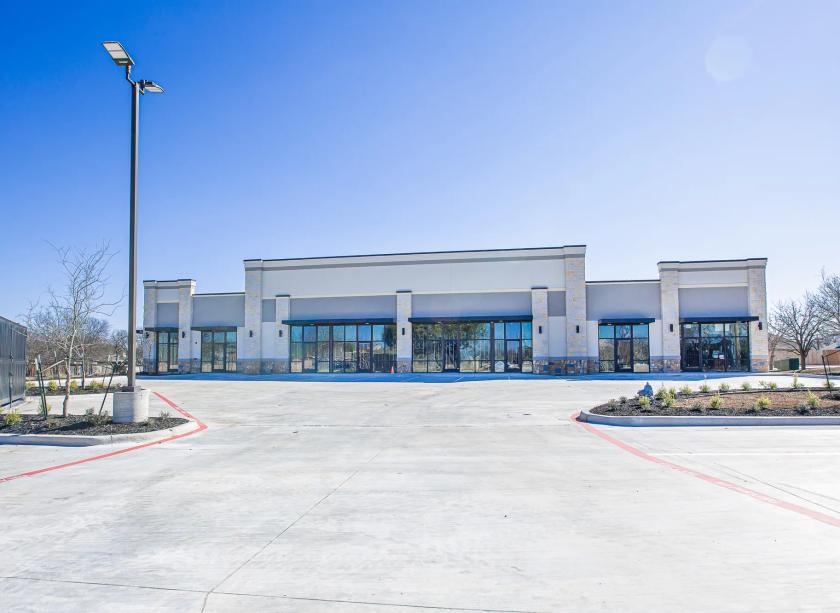
1-Mile | 3-Miles | 5-Miles | ||
---|---|---|---|---|
Total Population | 22,855 | 131,892 | 284,794 | |
Population Median Age | 34 | 34 | 35 | |
Population by Age | 0-9 Yrs | 3406 (14%) | 19722 (14%) | 41080 (14%) |
10-19 Yrs | 2999 (13%) | 18662 (14%) | 41313 (14%) | |
20-29 Yrs | 3511 (15%) | 19634 (14%) | 37498 (13%) | |
30-39 Yrs | 3747 (16%) | 21084 (15%) | 45217 (15%) | |
40-49 Yrs | 3218 (14%) | 18297 (13%) | 39336 (13%) | |
50-59 Yrs | 3180 (13%) | 15972 (12%) | 35208 (12%) | |
60-69 Yrs | 1632 (7%) | 12023 (9%) | 27573 (9%) | |
70+ Yrs | 1161 (5%) | 6498 (4%) | 17568 (6%) | |
Median HH Income | $74,996 | $81,810 | $84,020 | |
Total Household Income | < 24K | 545 (6%) | 4263 (9%) | 9339 (9%) |
25-49K | 1587 (19%) | 7749 (17%) | 15653 (16%) | |
50-74K | 1879 (23%) | 7824 (17%) | 17032 (17%) | |
75-99K | 1260 (15%) | 8318 (18%) | 17648 (18%) | |
100-199K | 2490 (31%) | 13729 (31%) | 30497 (31%) | |
200K+ | 261 (3%) | 2322 (5%) | 6616 (6%) | |
Highest Education Level | No Diploma | 1318 | 7826 | 18327 |
Diploma or GED | 3668 | 20998 | 46116 | |
Some College | 4146 | 21885 | 44267 | |
Assoc. Degree | 1595 | 7549 | 15986 | |
Bachelors Degree | 3173 | 19520 | 42873 | |
Higher Degree | 1052 | 6601 | 17141 | |
Total Housing Units | 8,369 | 46,420 | 101,529 | |
--Owner-Occupied | 5,521 | 28,276 | 66,095 | |
--Renter-Occupied | 2,500 | 15,930 | 30,688 | |
Owner-Occupied Values | < 100K | 544 | 1909 | 5843 |
100-199K | 3016 | 12398 | 23753 | |
200-299K | 1528 | 10403 | 23038 | |
300-399K | 322 | 2885 | 9020 | |
400-499K | 82 | 333 | 3077 | |
500K+ | 28 | 348 | 1363 | |
Total Working Age Population | 17,801 | 100,818 | 217,906 | |
In Work Force | 13,256 | 74,305 | 157,874 | |
Not In Work Force | 4,545 | 26,513 | 60,032 | |
Workforce Employed | 12,599 | 71,061 | 150,378 | |
Workforce Unemployed | 630 | 3,108 | 7,147 | |
Civlian Workforce | 13,229 | 74,169 | 157,525 | |
Military Workforce | 27 | 136 | 349 | |
Total Households | 8,020 | 44,206 | 96,783 | |
Family Households | 5,922 | 32,325 | 72,077 | |
Non-Family Households | 2,098 | 11,880 | 24,706 | |
Married Couple | 4,427 | 24,318 | 54,835 | |
Other Family | 1,495 | 8,007 | 17,242 | |
Married w/Child | 1,858 | 11,329 | 25,571 | |
Single Male w/Child | 123 | 1,307 | 2,428 | |
Single Female w/Child | 735 | 3,375 | 7,416 |
Population Change Last Two Decades - Plus Projection
2000 | % | 2010 | % | 2020 | % | 2030 | |
---|---|---|---|---|---|---|---|
Texas | 20,851,820 | +21 | 25,145,561 | +18 | 29,677,668 | +18 | 34,894,452 |
Tarrant County | 1,446,219 | +25 | 1,809,034 | +19 | 2,143,755 | +17 | 2,507,170 |
Total Working Age Population:
Total Households:
Total Working Age Population:
Total Households:
Total Working Age Population:
Total Households: