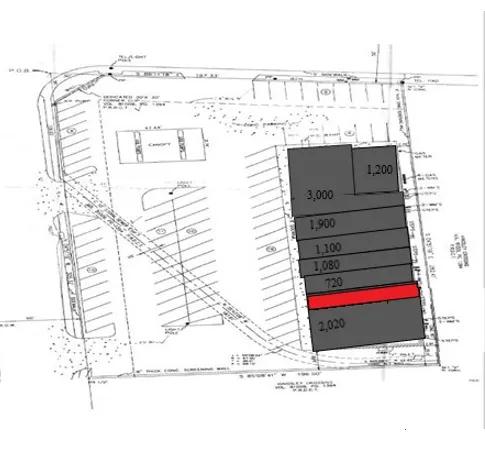
Retail Space
9644-9666 Plano Rd Dallas, TX 75238
9644-9666 Plano Rd Dallas, TX 75238
Details & Description
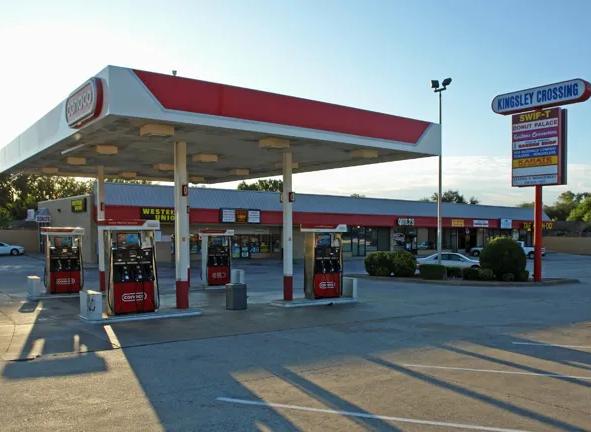
Property Highlights
• The center is conveniently located near neighborhoods located by LBJ Freeway (I-635) and Central Expressway &am
• Tenants include a large gas station, donut shop, martial arts school, and other neighborhood services
Listing Agents

Erik Fulkerson
O: 214-696-6677
info@crestcommercial.com
O: 214-696-6677
info@crestcommercial.com
While we strive to provide the most accurate information, all listing information, and demographic data, is provided by third-parties. As such, MyEListing will not be responsible for the accuracy of the information. It is strongly recommended that you verify all information with the listing agent, and any relevant agencies, prior to making any decisions.