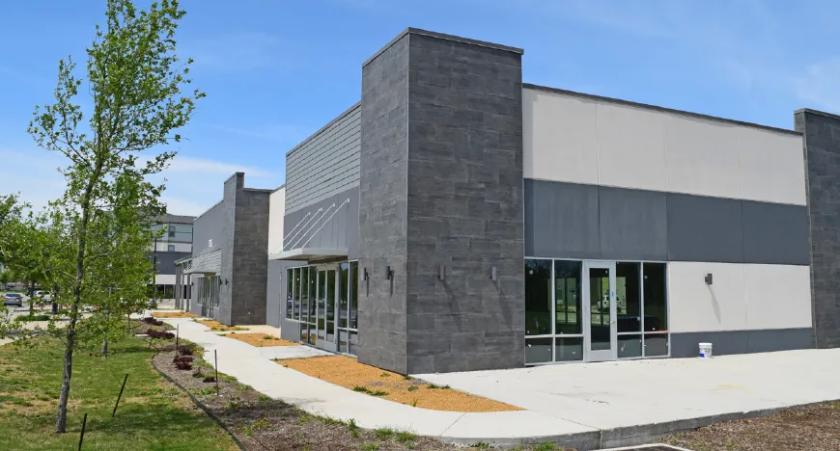
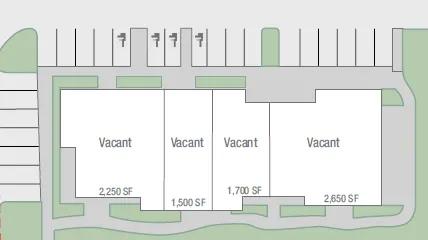
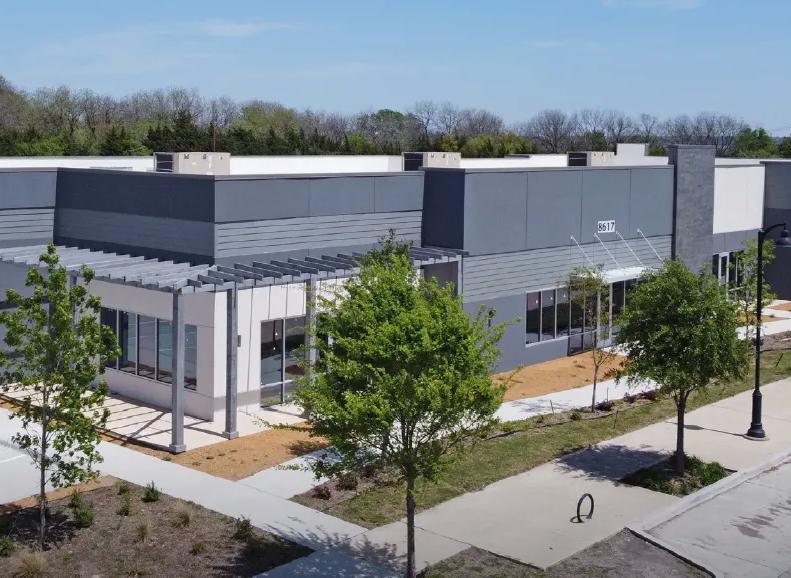
1-Mile | 3-Miles | 5-Miles | ||
---|---|---|---|---|
Total Population | 4,447 | 40,835 | 125,476 | |
Population Median Age | 36 | 39 | 38 | |
Population by Age | 0-9 Yrs | 843 (18%) | 5197 (12%) | 15627 (12%) |
10-19 Yrs | 414 (9%) | 5129 (12%) | 18491 (14%) | |
20-29 Yrs | 482 (10%) | 4831 (11%) | 14173 (11%) | |
30-39 Yrs | 699 (15%) | 5034 (12%) | 16527 (13%) | |
40-49 Yrs | 521 (11%) | 5778 (14%) | 17351 (13%) | |
50-59 Yrs | 843 (18%) | 6763 (16%) | 20902 (16%) | |
60-69 Yrs | 415 (9%) | 4654 (11%) | 12585 (10%) | |
70+ Yrs | 230 (5%) | 3448 (8%) | 9820 (7%) | |
Median HH Income | $78,974 | $88,120 | $94,490 | |
Total Household Income | < 24K | 146 (8%) | 1263 (8%) | 3602 (8%) |
25-49K | 218 (12%) | 2366 (16%) | 6647 (15%) | |
50-74K | 441 (25%) | 2738 (18%) | 6878 (16%) | |
75-99K | 293 (17%) | 1933 (13%) | 5487 (12%) | |
100-199K | 413 (24%) | 4469 (30%) | 15169 (35%) | |
200K+ | 192 (11%) | 1995 (13%) | 5027 (11%) | |
Highest Education Level | No Diploma | 194 | 1976 | 8195 |
Diploma or GED | 676 | 6502 | 17347 | |
Some College | 940 | 7688 | 21799 | |
Assoc. Degree | 230 | 2403 | 7604 | |
Bachelors Degree | 639 | 6410 | 18603 | |
Higher Degree | 248 | 3470 | 11115 | |
Total Housing Units | 1,764 | 15,596 | 44,670 | |
--Owner-Occupied | 1,143 | 10,869 | 32,267 | |
--Renter-Occupied | 560 | 3,895 | 10,542 | |
Owner-Occupied Values | < 100K | 56 | 600 | 1604 |
100-199K | 414 | 2586 | 8553 | |
200-299K | 431 | 4324 | 12528 | |
300-399K | 102 | 1630 | 4757 | |
400-499K | 65 | 814 | 2575 | |
500K+ | 76 | 915 | 2252 | |
Total Working Age Population | 3,346 | 32,685 | 98,662 | |
In Work Force | 2,494 | 23,060 | 69,108 | |
Not In Work Force | 852 | 9,625 | 29,554 | |
Workforce Employed | 2,331 | 22,102 | 66,100 | |
Workforce Unemployed | 160 | 947 | 2,973 | |
Civlian Workforce | 2,491 | 23,049 | 69,072 | |
Military Workforce | 3 | 11 | 36 | |
Total Households | 1,704 | 14,763 | 42,809 | |
Family Households | 1,294 | 11,595 | 34,348 | |
Non-Family Households | 410 | 3,168 | 8,462 | |
Married Couple | 961 | 8,852 | 27,305 | |
Other Family | 333 | 2,743 | 7,042 | |
Married w/Child | 331 | 3,023 | 10,706 | |
Single Male w/Child | 134 | 513 | 1,038 | |
Single Female w/Child | 84 | 891 | 2,604 |
Population Change Last Two Decades - Plus Projection
2000 | % | 2010 | % | 2020 | % | 2030 | |
---|---|---|---|---|---|---|---|
Texas | 20,851,820 | +21 | 25,145,561 | +18 | 29,677,668 | +18 | 34,894,452 |
Rockwall County | 43,080 | +82 | 78,337 | +31 | 102,243 | +31 | 134,114 |
Kaufman County | 71,313 | +45 | 103,350 | +21 | 125,134 | +22 | 152,682 |
Dallas County | 2,218,899 | +7 | 2,368,139 | +15 | 2,734,111 | +14 | 3,106,298 |
Total Working Age Population:
Total Households:
Total Working Age Population:
Total Households:
Total Working Age Population:
Total Households: