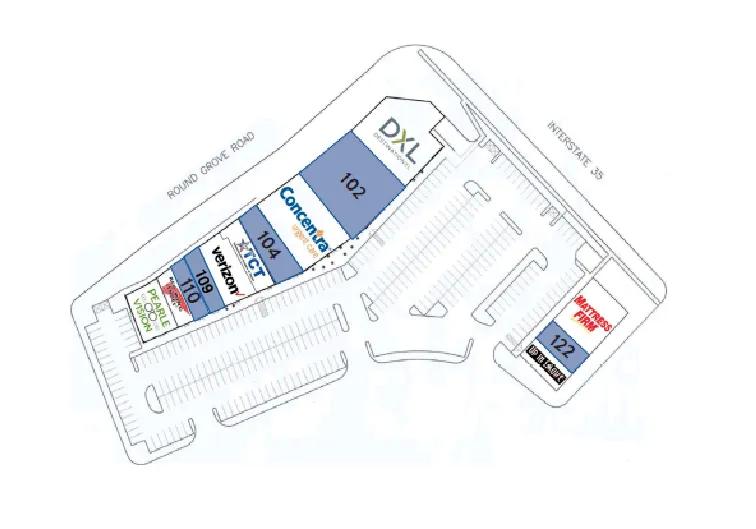
Retail Space
2403 South Stemmons Freeway Lewisville, TX 75067
2403 South Stemmons Freeway Lewisville, TX 75067
Details & Description
Property Highlights
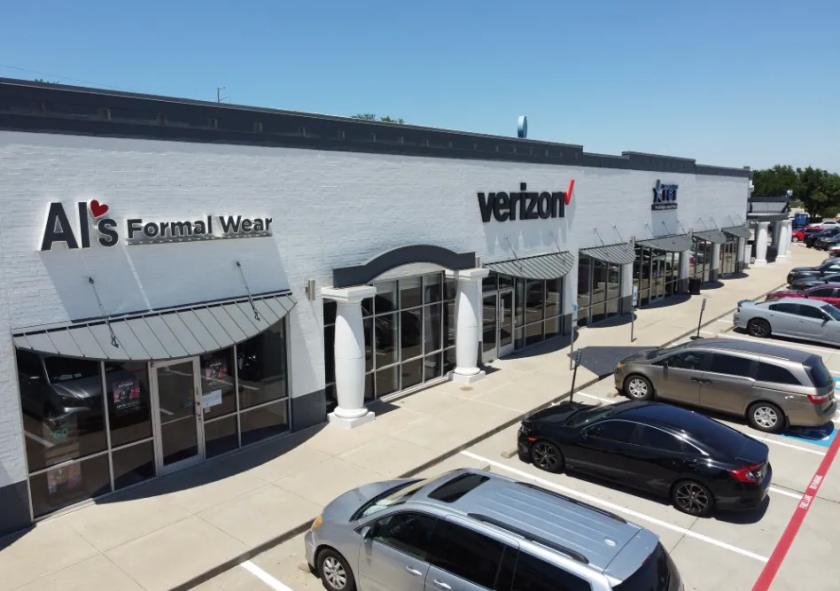
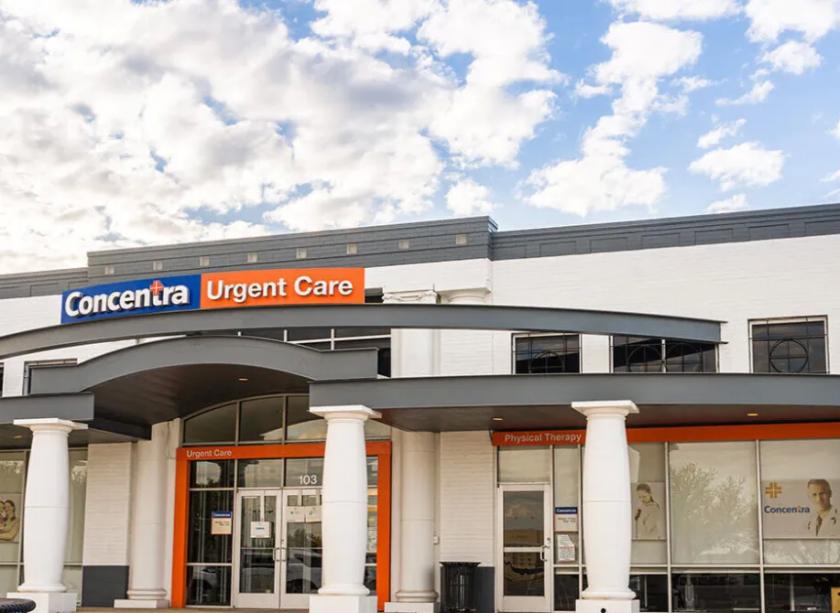
• Numerous national retailers, restaurants, grocers, and entertainment centers in the immediate vicinity
• Located on a major retail corridor serving Lewisville, Hebron, Carrollton, and Highland Village
Listing Agents

Erik Fulkerson
O: 214-696-6677
info@crestcommercial.com
O: 214-696-6677
info@crestcommercial.com
While we strive to provide the most accurate information, all listing information, and demographic data, is provided by third-parties. As such, MyEListing will not be responsible for the accuracy of the information. It is strongly recommended that you verify all information with the listing agent, and any relevant agencies, prior to making any decisions.