Retail Space
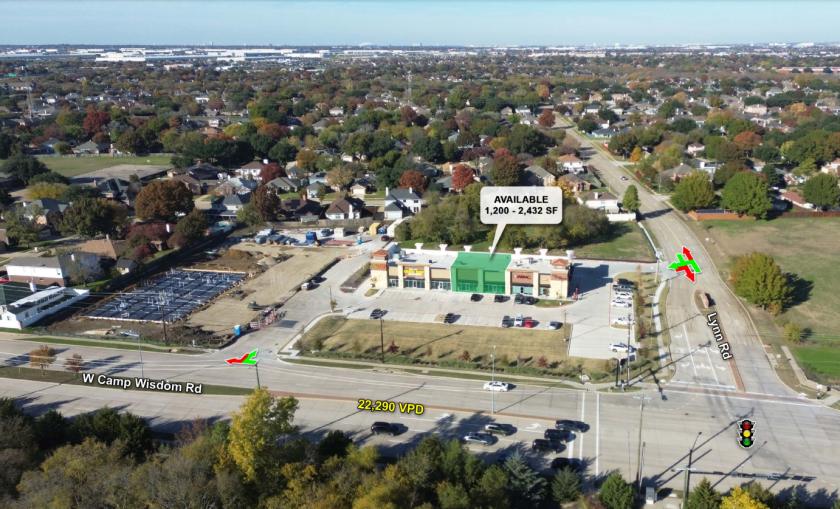
2800 West Camp Wisdom Road Grand Prairie, TX 75052
2800 West Camp Wisdom Road Grand Prairie, TX 75052
Details & Description
Property Highlights
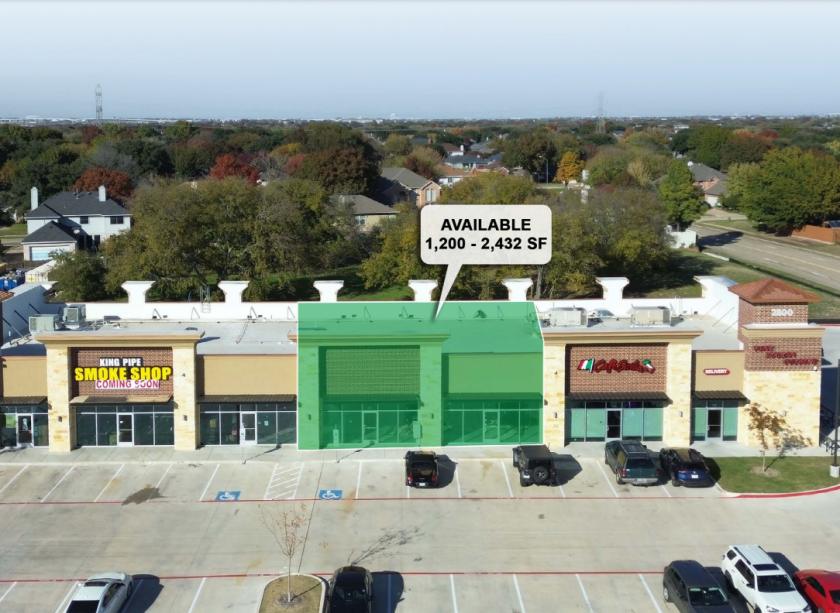
- • Inline space available
- • Signalized Intersection
- • Less than half a mile from TX-360
- • Daycare Facility Under Construction next door
Listing Agents

Chris Flesner
O: 469-386-8987
chris@resolutre.com
O: 469-386-8987
chris@resolutre.com

Connor Coughlin
O: 469-563-6020
ccoughlin@resolutre.com
O: 469-563-6020
ccoughlin@resolutre.com
While we strive to provide the most accurate information, all listing information, and demographic data, is provided by third-parties. As such, MyEListing will not be responsible for the accuracy of the information. It is strongly recommended that you verify all information with the listing agent, and any relevant agencies, prior to making any decisions.