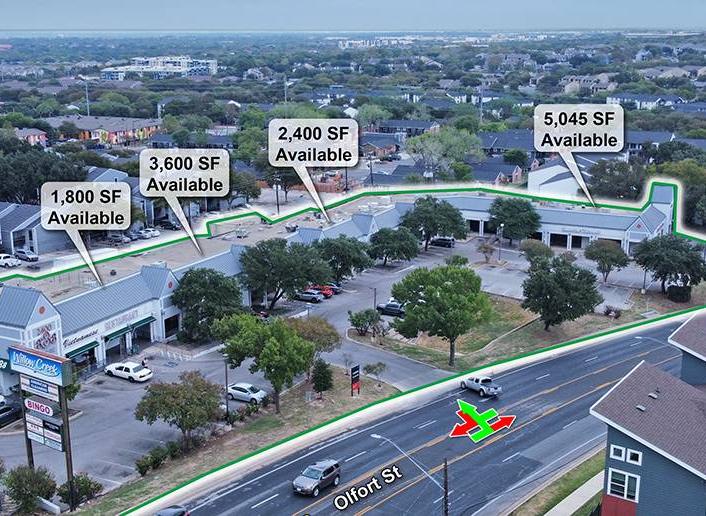
1-Mile | 3-Miles | 5-Miles | ||
---|---|---|---|---|
Total Population | 25,986 | 136,597 | 305,572 | |
Population Median Age | 31 | 34 | 34 | |
Population by Age | 0-9 Yrs | 2679 (10%) | 13132 (9%) | 28000 (9%) |
10-19 Yrs | 1791 (6%) | 12513 (9%) | 35401 (11%) | |
20-29 Yrs | 9414 (36%) | 35302 (25%) | 79755 (26%) | |
30-39 Yrs | 6067 (23%) | 30395 (22%) | 60797 (19%) | |
40-49 Yrs | 2471 (9%) | 16893 (12%) | 37946 (12%) | |
50-59 Yrs | 1683 (6%) | 13327 (9%) | 27720 (9%) | |
60-69 Yrs | 1303 (5%) | 8990 (6%) | 21337 (6%) | |
70+ Yrs | 577 (2%) | 6045 (4%) | 14616 (4%) | |
Median HH Income | $50,395 | $67,648 | $68,001 | |
Total Household Income | < 24K | 2728 (22%) | 11371 (18%) | 24493 (19%) |
25-49K | 3348 (27%) | 11475 (19%) | 23807 (18%) | |
50-74K | 2610 (21%) | 9950 (16%) | 21065 (16%) | |
75-99K | 1444 (11%) | 7405 (12%) | 15598 (12%) | |
100-199K | 1735 (14%) | 13827 (22%) | 29704 (23%) | |
200K+ | 378 (3%) | 6118 (10%) | 12435 (9%) | |
Highest Education Level | No Diploma | 2959 | 14422 | 25932 |
Diploma or GED | 3118 | 16681 | 32360 | |
Some College | 3095 | 15416 | 32767 | |
Assoc. Degree | 1210 | 4389 | 9341 | |
Bachelors Degree | 5490 | 31404 | 68207 | |
Higher Degree | 2044 | 15045 | 36585 | |
Total Housing Units | 13,583 | 66,290 | 139,953 | |
--Owner-Occupied | 1,470 | 18,782 | 46,401 | |
--Renter-Occupied | 10,772 | 41,366 | 80,701 | |
Owner-Occupied Values | < 100K | 154 | 1402 | 2649 |
100-199K | 212 | 2471 | 5927 | |
200-299K | 362 | 3360 | 9214 | |
300-399K | 314 | 2961 | 8383 | |
400-499K | 193 | 2556 | 5853 | |
500K+ | 235 | 6032 | 14374 | |
Total Working Age Population | 22,366 | 116,942 | 263,440 | |
In Work Force | 18,938 | 91,670 | 194,144 | |
Not In Work Force | 3,428 | 25,272 | 69,296 | |
Workforce Employed | 18,513 | 87,576 | 185,252 | |
Workforce Unemployed | 400 | 4,054 | 8,821 | |
Civlian Workforce | 18,913 | 91,631 | 194,073 | |
Military Workforce | 25 | 39 | 71 | |
Total Households | 12,242 | 60,147 | 127,102 | |
Family Households | 3,564 | 23,613 | 53,690 | |
Non-Family Households | 8,678 | 36,534 | 73,411 | |
Married Couple | 1,869 | 14,818 | 35,911 | |
Other Family | 1,695 | 8,795 | 17,779 | |
Married w/Child | 588 | 5,306 | 13,809 | |
Single Male w/Child | 127 | 687 | 1,642 | |
Single Female w/Child | 849 | 3,665 | 6,865 |
Population Change Last Two Decades - Plus Projection
2000 | % | 2010 | % | 2020 | % | 2030 | |
---|---|---|---|---|---|---|---|
Texas | 20,851,820 | +21 | 25,145,561 | +18 | 29,677,668 | +18 | 34,894,452 |
Travis County | 812,280 | +26 | 1,024,266 | +26 | 1,291,502 | +19 | 1,540,812 |
Total Working Age Population:
Total Households:
Total Working Age Population:
Total Households:
Total Working Age Population:
Total Households: