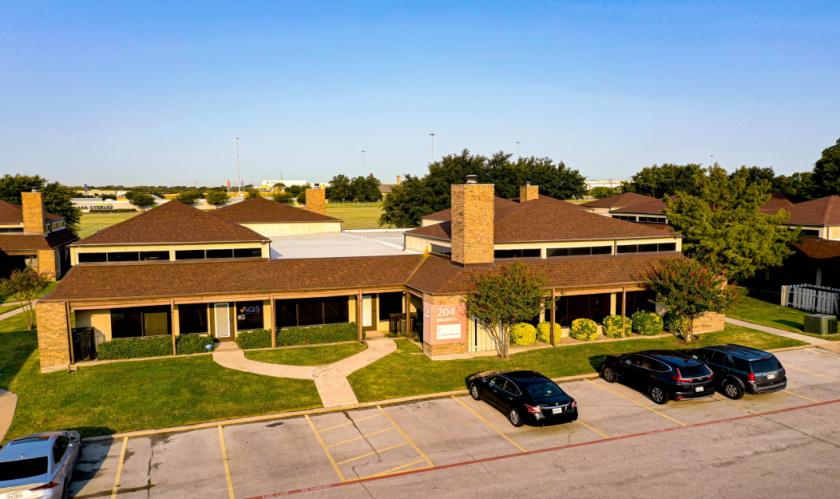
Office Space
208 Billings Street Arlington, TX 76010
208 Billings Street Arlington, TX 76010

Details & Description
Property Highlights
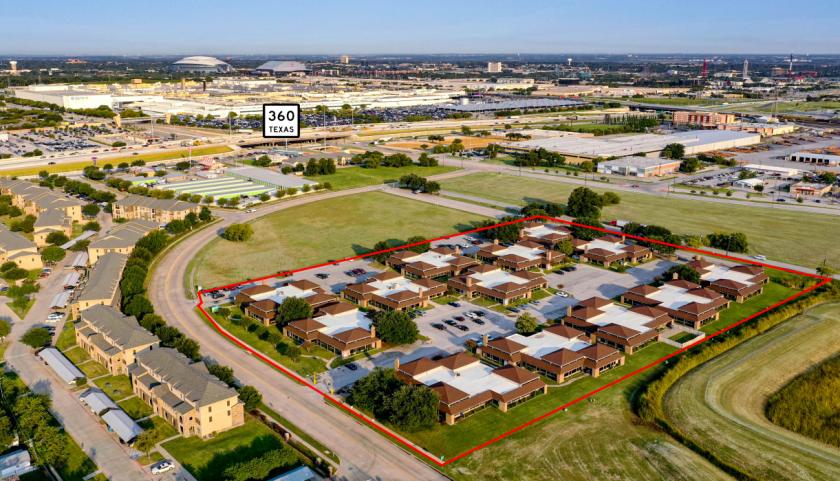
- • Direct access to Hwy 360 & General Motors
- • Exterior Entrances on all office suites
- • Second Generation office suites available
- • Ample Surface Parking
- • Responsive and Local Management
Listing Agents

JP Humphrey III
O: 817-436-1067
M: 817-716-5393
jphumphrey@advisorstx.com
O: 817-436-1067
M: 817-716-5393
jphumphrey@advisorstx.com
While we strive to provide the most accurate information, all listing information, and demographic data, is provided by third-parties. As such, MyEListing will not be responsible for the accuracy of the information. It is strongly recommended that you verify all information with the listing agent, and any relevant agencies, prior to making any decisions.