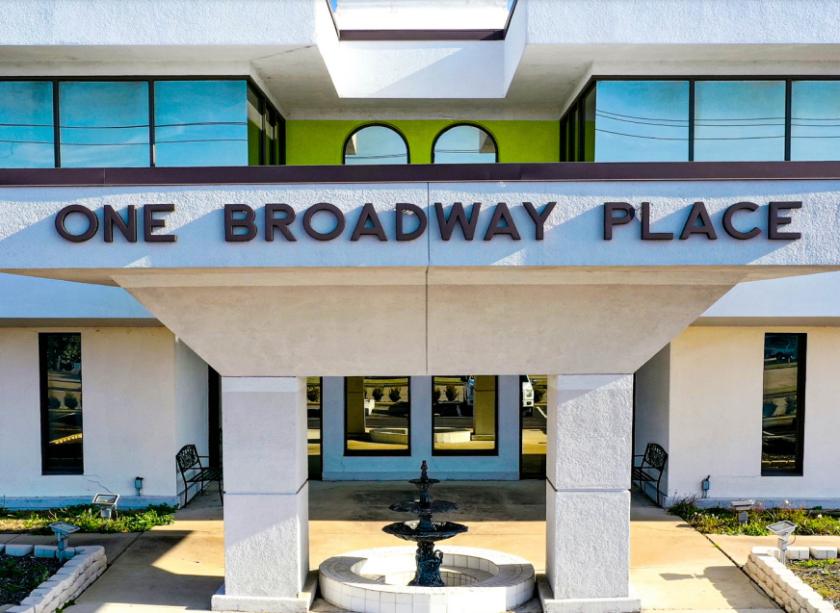
Office Space
2910 Broadway Boulevard Garland, TX 75041
2910 Broadway Boulevard Garland, TX 75041
Details & Description
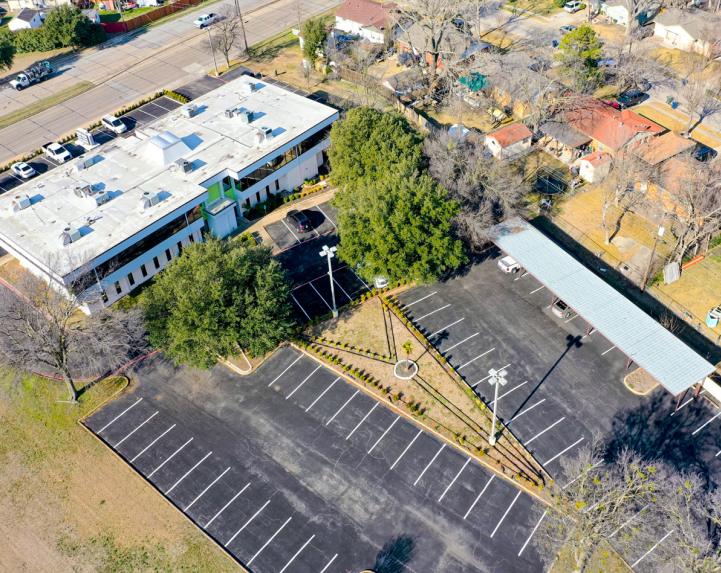
Property Highlights
- • 2nd Generation Medical Office
- • Newly Renovated Common Area
- • Monument Signage Available
- • Tenant Improvement Packages Available
- • Parking Ratio 7.0/1,000 SF
- • Covered Parking Available
Additional Photos


Listing Agents

JP Humphrey III
O: 817-436-1067
M: 817-716-5393
jphumphrey@advisorstx.com
O: 817-436-1067
M: 817-716-5393
jphumphrey@advisorstx.com

Phillip Hooks Jr
O: 469-286-7870
phooks@advisorstx.com
O: 469-286-7870
phooks@advisorstx.com
While we strive to provide the most accurate information, all listing information, and demographic data, is provided by third-parties. As such, MyEListing will not be responsible for the accuracy of the information. It is strongly recommended that you verify all information with the listing agent, and any relevant agencies, prior to making any decisions.


