Office Space
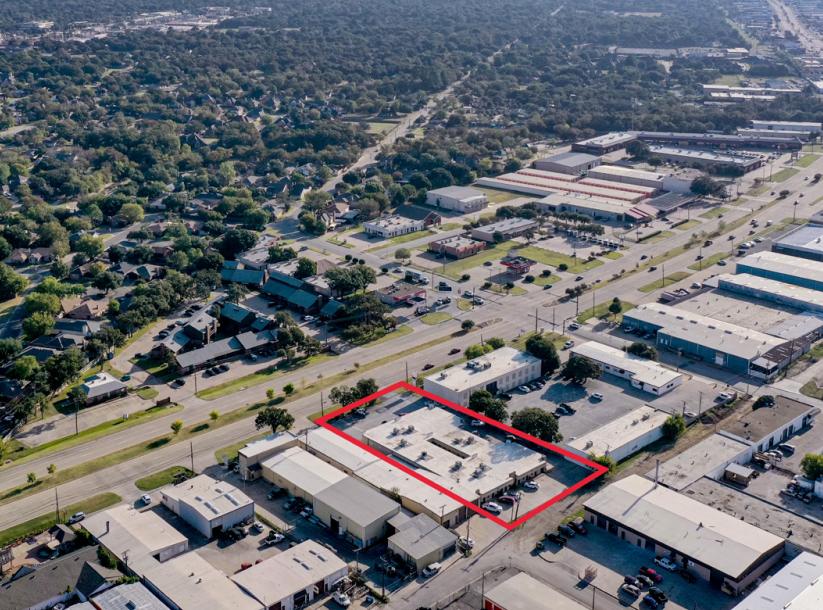
3630 West Pioneer Parkway Pantego, TX 76013
3630 West Pioneer Parkway Pantego, TX 76013
Details & Description
Property Highlights
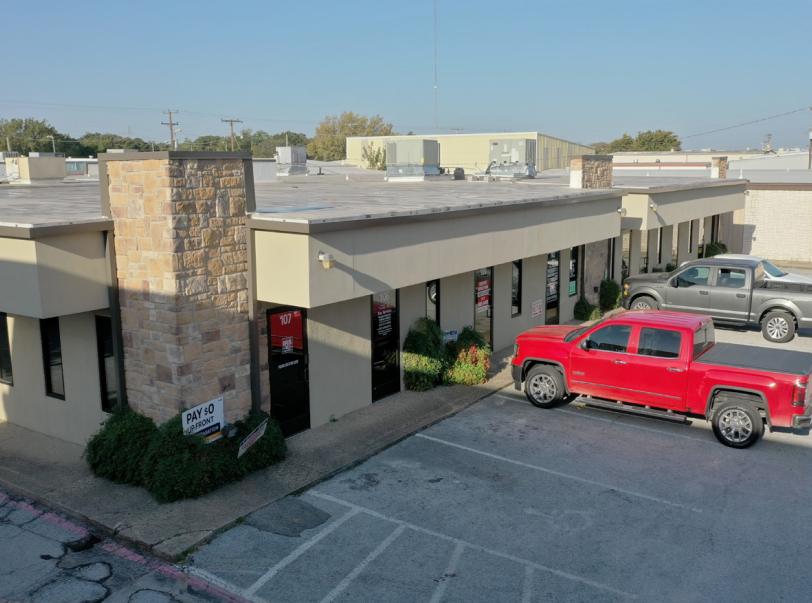
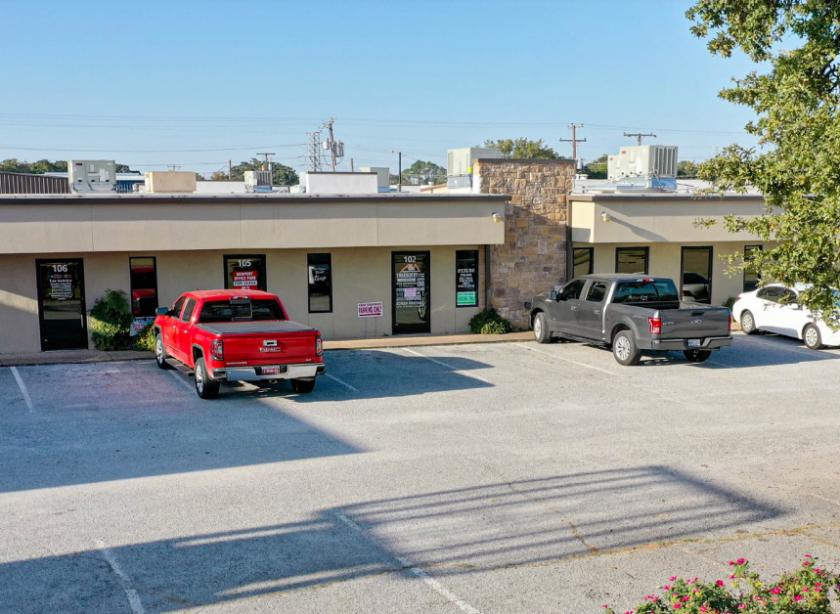
- • Executive Office Suites (Move In Ready)
- • Great Accessibility to Pioneer Pkwy
- • Strong Local Ownership
Listing Agents

JP Humphrey III
O: 817-436-1067
M: 817-716-5393
jphumphrey@advisorstx.com
O: 817-436-1067
M: 817-716-5393
jphumphrey@advisorstx.com
While we strive to provide the most accurate information, all listing information, and demographic data, is provided by third-parties. As such, MyEListing will not be responsible for the accuracy of the information. It is strongly recommended that you verify all information with the listing agent, and any relevant agencies, prior to making any decisions.